Introduction
In today's digital landscape, delivering a fast and seamless user experience is paramount. However, navigating the intricacies of a modern web stack often reveals numerous performance pitfalls that can compromise your web application's responsiveness. Whether it's sluggish database queries, overloaded web servers, inefficient PHP code, or suboptimal application logic, pinpointing the exact cause of slowdowns is essential for effective performance optimization.
This guide is designed to help you systematically identify and resolve common performance bottlenecks across various layers of your web stack. By understanding the root causes of these slowdowns, you can implement targeted optimizations that not only enhance site speed but also improve user satisfaction and reduce operational costs.
Topics covered in this guide include:
-
Identifying Database Performance Issues: Learn to recognize signs of database-related slowdowns and discover techniques for monitoring and optimizing database performance.
-
Diagnosing Web Server Slowdowns: Uncover indicators of web server issues and explore strategies for tuning server configurations and resource allocation.
-
Evaluating PHP Performance: Identify and address performance bottlenecks in PHP applications with insights into profiling and script optimization.
-
Analyzing Application-Level Bottlenecks: Detect and resolve inefficiencies within your application logic using best practices for code optimization and asynchronous processing.
-
Using LoadForge for Comprehensive Load Testing: Understand the critical role of load testing in diagnosing performance issues and follow a step-by-step guide to using LoadForge for simulating real-world traffic.
-
Implementing Monitoring and Alerting Systems: Set up real-time performance tracking and alerting systems to enable proactive issue resolution.
-
Best Practices for Ongoing Performance Optimization: Maintain and continuously improve web stack performance with a summarized list of best practices.
The benefits of efficient performance tuning extend beyond just faster load times. By diligently optimizing your web stack, you can achieve:
-
Enhanced User Experience: Faster response times and smoother interactions keep users engaged and increase conversion rates.
-
Improved Search Engine Rankings: Performance is a critical factor in SEO, and faster sites are often rewarded with better visibility.
-
Reduced Operational Costs: Efficient resource usage reduces the burden on your infrastructure, potentially lowering hosting and maintenance expenses.
-
Scalability: A well-optimized web stack can handle higher traffic volumes, supporting your growth without compromising performance.
Throughout this guide, we'll provide practical tips, real-world examples, and actionable insights to help you transform your web stack into a well-oiled machine. Let's embark on this journey to mastery over web performance and ensure that your users receive the high-quality experience they deserve.
## Identifying Database Performance Issues

One of the most critical components of a web stack is the database. Its performance directly affects how swiftly your application can retrieve, process, and display data to users. Detecting and diagnosing database performance issues early can prevent slowdowns that could degrade the user experience and strain server resources. This section explores common symptoms of database performance problems and provides actionable strategies for monitoring and optimizing database performance.

### Common Signs of Database-Related Slowdowns

Recognizing the symptoms of database performance issues is the first step towards effective troubleshooting. Here are some common indicators:

- **High Query Times**: Slow query execution is a clear sign of database performance problems. This can often be seen in increased page load times.
- **Connection Bottlenecks**: When connections to the database are maxed out, new user requests are left waiting. This results in slower overall response times.
- **Increased CPU and Memory Usage**: High resource consumption by the database server can indicate inefficient queries or lack of proper indexing.
- **Deadlocks and Timeouts**: These occur when queries are unable to complete due to resource contention, leading to failed operations and a poor user experience.

### Tips for Monitoring and Optimizing Database Performance

Effectively troubleshooting database performance issues involves a combination of monitoring tools and optimization techniques. Below are some best practices to consider:

#### 1. **Enable Slow Query Logs**

Slow query logs can help you identify queries that are taking longer than expected. Configuring your database to log queries that exceed a specified duration allows you to pinpoint problem areas.

For MySQL, you can enable slow query logging with the following configuration in `my.cnf`:

<pre><code>[mysqld]
slow_query_log = 1
slow_query_log_file = /var/log/mysql-slow.log
long_query_time = 2  # Log queries that take longer than 2 seconds
</code></pre>

#### 2. **Indexing Strategies**

Indexes can significantly improve query performance by allowing the database to locate rows faster. However, creating too many indexes can slow down write operations. Focus on optimizing indexes based on query patterns.

Example of creating an index in SQL:

<pre><code>CREATE INDEX idx_user_email ON users(email);
</code></pre>

#### 3. **Optimizing Queries**

Review and optimize your SQL queries to ensure they are efficient. Use EXPLAIN or EXPLAIN ANALYZE in PostgreSQL to understand how your queries are executed and identify potential bottlenecks.

Example:

<pre><code>EXPLAIN SELECT * FROM users WHERE email = 'example@example.com';
</code></pre>

#### 4. **Connection Pooling**

Implement connection pooling to manage database connections efficiently. Connection pooling reduces the overhead of establishing new connections and can significantly improve performance.

#### 5. **Regular Maintenance Tasks**

- **Vacuum and Analyze**: For databases like PostgreSQL, regular vacuuming and analyzing help to reclaim storage and update statistics, aiding the query planner in making optimal decisions.
- **Rebuild Indexes**: Periodically rebuilding indexes can help to maintain their effectiveness.

### Monitoring Tools and Techniques

Several tools can assist in monitoring and diagnosing database performance issues:

- **MySQL Workbench** for real-time performance monitoring and query analysis.
- **pgAdmin** for PostgreSQL monitoring and query optimizations.
- **New Relic** and **Datadog** for comprehensive application performance monitoring and alerting, including database metrics.

By using these tools and adopting a proactive approach to database management, you can dramatically improve the performance and reliability of your database, ensuring a smoother and more responsive user experience in your web application.

## Diagnosing Web Server Slowdowns

Web server performance is a critical component of the overall responsiveness and reliability of your web application. When your web server experiences slowdowns, it can lead to high response times, increased server load, and higher error rates. This section will help you identify common web server issues and introduce methods for tuning performance through configuration adjustments and resource allocation.

### Typical Indicators of Web Server Issues

Understanding the common signs of web server performance issues can help you quickly diagnose and address problems. Key indicators to watch for include:

- **High Response Times**: When your web server takes longer to respond to requests, users experience delayed load times. Tools like **Apache JMeter** or **LoadForge** can help measure response times under load.
- **Increased Server Load**: A web server under heavy load may struggle to process incoming requests efficiently. Monitoring CPU and memory usage can provide insight into whether your server resources are being overutilized.
- **Error Rates**: An increase in HTTP error rates, such as 500 Internal Server Errors, can signal that your web server is experiencing difficulties handling requests. Log analysis tools can help pinpoint the causes of these errors.

### Tuning Web Server Performance

Once you have identified potential indicators, the next step is to implement tuning strategies to optimize your web server's performance. Here are some methods to consider:

#### Configuration Adjustments

1. **Optimize the Web Server Configuration**:
    - **Apache:**
      - Adjust `Timeout` to a lower value if high response times are due to slow clients.
      - Enable **Keep-Alive** connections for reusing connections per client.
      - Optimize `MaxRequestWorkers` to ensure your server can handle the desired number of concurrent connections.

      ```apache
      Timeout 30
      KeepAlive On
      MaxRequestWorkers 100
      ```

    - **Nginx:**
      - Tune `worker_processes` based on the number of CPU cores.
      - Adjust `worker_connections` to manage the number of simultaneous connections.
      - Use `gzip` to compress responses and reduce load times.

      ```nginx
      worker_processes  auto;
      events {
          worker_connections  1024;
      }
      gzip  on;
      ```

2. **Load Balancing**: Employ a load balancer to distribute incoming traffic across multiple servers, ensuring that no single server becomes a bottleneck. Tools like **HAProxy** or **NGINX** can serve as reverse proxies to manage this distribution.

#### Resource Allocation

1. **Scaling Resources**:
    - **Vertical Scaling**: Upgrade your server hardware to provide more CPU, memory, or disk space if current resources are inadequate.
    - **Horizontal Scaling**: Add additional servers to the web server pool to handle more simultaneous requests.

2. **Caching**:
    - Use **Content Delivery Networks (CDNs)** to cache static resources closer to users.
    - Implement server-side caching mechanisms, such as **Varnish Cache**, to reduce the load on the web server by serving cached responses for frequently requested resources.

3. **Database Connection Pooling**: Limit the number of simultaneous connections to the database by using connection pooling techniques. This can prevent your web server from being overwhelmed by too many open database connections.

#### An Example of Optimizing Apache Configuration

Here’s an example of how you could optimize the Apache web server’s configuration settings:

<pre><code>
# Optimized Apache Configuration
Timeout 20
KeepAlive On
MaxKeepAliveRequests 100
KeepAliveTimeout 5

<IfModule mpm_prefork_module>
    StartServers 5
    MinSpareServers 5
    MaxSpareServers 10
    MaxRequestWorkers 150
    MaxConnectionsPerChild 3000
</IfModule>
</code></pre>

In this configuration:
- `Timeout` is set to 20 seconds to prevent slow clients from occupying server resources.
- `KeepAlive` is enabled to improve connection reuse.
- `MaxRequestWorkers` is adjusted based on server capacity.

### Conclusion

By carefully monitoring key indicators and applying targeted performance tuning techniques, you can effectively diagnose and resolve web server slowdowns. Configuration adjustments, resource allocation optimization, load balancing, and caching are powerful tools that can drastically enhance your server's performance. Implement these strategies to ensure that your web server remains robust, responsive, and able to handle varying traffic loads efficiently.

## Evaluating PHP Performance

Understanding and optimizing PHP performance is critical for ensuring that your web application runs smoothly and efficiently. This section focuses on identifying common performance bottlenecks in PHP applications, such as inefficient code, memory leaks, and high CPU usage. We will also provide insights into profiling and optimizing PHP scripts to improve their execution speed.

### Common PHP Performance Bottlenecks

#### 1. Inefficient Code
- **Looping through large datasets inefficiently**: Avoid nested loops that result in a high computational cost. Instead, try to optimize the dataset processing logic.
- **Redundant database queries**: Minimize the number of database queries within loops or repeatedly requested during a single request lifecycle.
- **Poor use of built-in functions**: Leverage PHP's built-in functions which are often optimized in C and faster than their PHP counterparts.

#### 2. Memory Leaks
- **Unreleased variables**: Ensure variables are unset when no longer needed.
- **Persistent connections**: Use persistent database connections with caution as they can consume memory if not properly managed.

#### 3. High CPU Usage
- **Heavy computation without optimization**: Break down large computational tasks or use more efficient algorithms.
- **Inefficient recursion**: Avoid deep recursive functions that could be replaced with iterative solutions.

### Profiling and Optimizing PHP Scripts

PHP performance profiling helps in pinpointing bottlenecks at the code level. Here are tools and methods to profile and optimize your PHP code:

#### 1. Using Xdebug for Profiling
Xdebug is a powerful tool for profiling PHP code. It provides a detailed breakdown of function calls, execution times, and memory usage.

**Setting up Xdebug:**
1. Install Xdebug:
   ```sh
   pecl install xdebug
-
Configure php.ini:
[xdebug]
zend_extension=xdebug.so
xdebug.profiler_enable=1
xdebug.profiler_output_dir=/path/to/profiler/logs
-
Restart your web server:
sudo service apache2 restart   # for Apache
sudo service php7.4-fpm restart  # for PHP-FPM
Analyzing Profile Data:
2. Optimizing PHP Code
Refactoring Loops:
// Inefficient query inside a loop
foreach ($users as $user) {
    $details = $db->query("SELECT * FROM user_details WHERE user_id = {$user['id']}");
    // process details...
}

// Optimized with a single query
$user_ids = array_column($users, 'id');
$details = $db->query("SELECT * FROM user_details WHERE user_id IN (".implode(',', $user_ids).")");
// process details...
Using Built-in Functions:
// Inefficient: Custom search
function custom_search($arr, $val) {
    foreach ($arr as $item) {
        if ($item == $val) return true;
    }
    return false;
}

// Optimized: Using built-in function
in_array($val, $arr);
Memory Leak Management:
// Inefficient: Variables consuming memory
$largeArray = range(1, 1000000);
// Some operations...

// Remove variable when done
unset($largeArray);
Conclusion
Efficient PHP performance tuning begins with identifying bottlenecks and addressing them through profiling and optimization. By focusing on coding best practices, memory management, and computational efficiency, you can significantly enhance the execution speed of your PHP applications. Using tools like Xdebug will empower you to gain deep insights into your application’s performance, allowing for targeted improvements.
Analyzing Application-Level Bottlenecks
Identifying and resolving performance issues within your application logic is pivotal to maintaining a fast, responsive web stack. Application-level bottlenecks can arise from inefficient code, poor algorithm choices, and improper handling of asynchronous tasks. In this section, we will explore effective strategies to diagnose and resolve these bottlenecks, ensuring that your application runs smoothly.
Detecting Application Bottlenecks
To systematically identify bottlenecks in your application, you need to start by profiling your code. Profiling helps pinpoint the parts of your application that consume the most resources or take the most time to execute. Here are some key tools and techniques:
-
Profiling Tools: Use profiling tools like Xdebug, Blackfire, or New Relic to gather detailed performance data about your application. These tools can highlight slow functions, high memory usage points, and other critical areas for optimization.
-
Logging and Monitoring: Implement custom logging to track execution times of critical functions. Use monitoring tools like ELK Stack (Elasticsearch, Logstash, Kibana) to visualize and analyze this data effectively.
Best Practices for Code Optimization
Optimizing your code is the first step toward resolving application-level bottlenecks. Here are some best practices to follow:
-
Avoid Redundant Operations: Minimize repetitive tasks within loops. Cache results of expensive computations if they need to be reused.
// Inefficient
for ($i = 0; $i < count($items); $i++) {
    // Do something
}

// Efficient
$itemCount = count($items);
for ($i = 0; $i < $itemCount; $i++) {
    // Do something
}
-
Optimize Database Queries: Instead of making multiple database calls, batch your queries or use joins to fetch necessary data in fewer calls.
// Inefficient
$users = [];
foreach ($userIds as $id) {
    $users[] = getUserById($id);
}

// Efficient
$users = getUsersByIds($userIds);
-
Leverage Built-in Functions: Use native functions provided by your programming language, which are often optimized for performance.
// Inefficient
$result = '';
foreach ($array as $item) {
    $result .= $item;
}

// Efficient
$result = implode('', $array);
Asynchronous Processing
Asynchronous processing can dramatically improve the performance of applications by offloading time-consuming tasks from the main execution flow. Consider using the following:
-
Message Queues: Use message queuing systems like RabbitMQ or AWS SQS to handle background tasks and offload them from your main processing pipeline.
-
Async Libraries: Utilize libraries that provide asynchronous capabilities. For example, in PHP, libraries like ReactPHP or Symfony’s Messenger component can be extremely useful.
// Example using ReactPHP
use React\EventLoop\Factory;
$loop = Factory::create();

$loop->addTimer(1, function () {
    echo "This is a delayed message.\n";
});

$loop->run();
Efficient Algorithm Design
Selecting the right algorithms and data structures is crucial for optimizing application performance. Here are a few tips:
-
Choose the Right Data Structures: Use the most appropriate data structures for your needs (e.g., hash tables for lookups, arrays for sequential data).
-
Algorithm Complexity: Prefer algorithms with lower time and space complexity, especially for operations on large datasets.
Conclusion
By implementing these strategies, you can effectively identify and resolve application-level bottlenecks. Ensure ongoing optimization through regular profiling, code reviews, and making use of asynchronous processing to maintain a high-performing application. The subsequent sections will provide further insights into maintaining a robust web stack.
Using LoadForge for Comprehensive Load Testing
Load testing is a critical step in diagnosing performance issues in your web stack. It helps simulate real-world traffic, revealing how your system behaves under stress. LoadForge is a powerful load testing tool that can assist in identifying bottlenecks and evaluating overall system performance. In this section, we will explore the importance of load testing and provide a practical guide for using LoadForge effectively.
Importance of Load Testing
- Identify Bottlenecks: Load testing replicates high-traffic scenarios, uncovering which component—be it database, web server, PHP, or the application itself—fails to keep up with increased load.
- Measure Performance: By simulating user interactions, you can measure response times, throughput, and reliability, ensuring your application can handle peak loads.
- Optimize Resources: Load testing helps determine if your current resource allocation (CPU, memory, etc.) is adequate or needs adjustment.
- Prevent Downtime: Preemptive identification of weak points in your stack allows for proactive mitigation strategies, reducing the risk of unexpected outages.
Step-by-Step Guide to Load Testing with LoadForge
Step 1: Sign Up and Log In
Start by signing up for an account on LoadForge. Once registered, log in to access the dashboard.
Step 2: Create a New Test
Navigate to the "Tests" section and click on "Create New Test." Fill in the basic settings like test name and description.
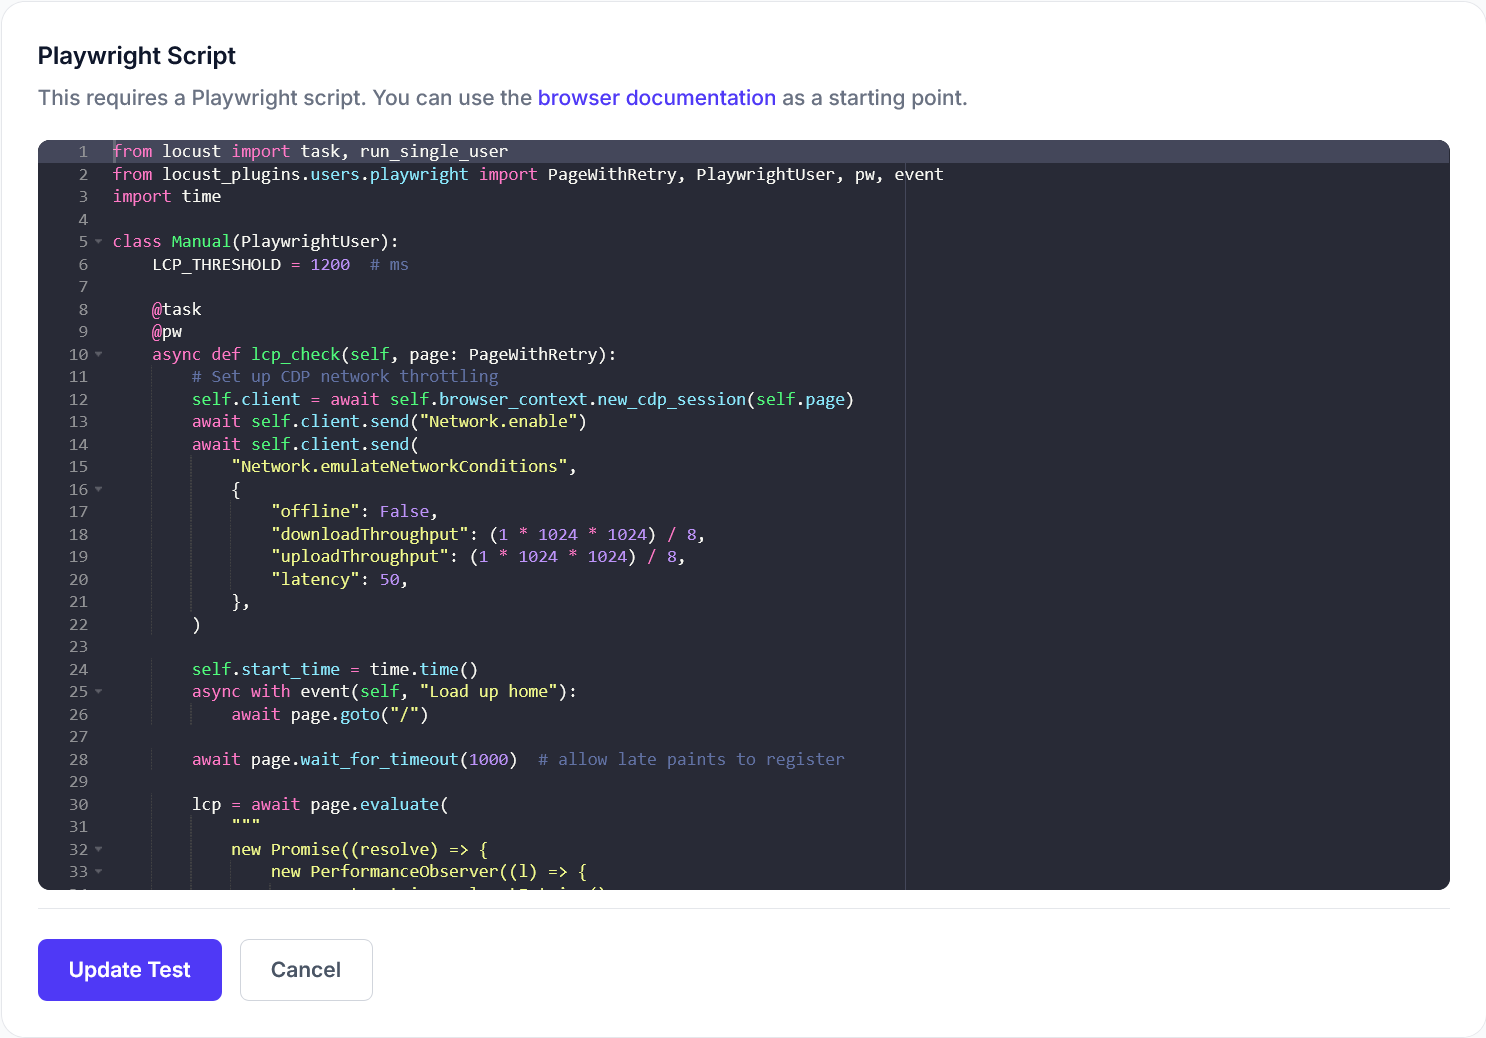
Step 3: Configure Test Scenarios
Define your load test scenarios:
- URL: Specify the endpoints to be tested.
- Request Type: Choose between GET, POST, PUT, etc., based on your application's interactions.
- Headers and Parameters: Customize headers and parameters as needed to replicate real-world usage.
- Ramp-up Period: Set the ramp-up period to gradually increase load, mimicking natural traffic growth.
Example configuration:
{
  "scenarios": [
    {
      "name": "Home Page Load",
      "path": "/",
      "method": "GET",
      "headers": {}
    },
    {
      "name": "User Login",
      "path": "/login",
      "method": "POST",
      "headers": {
        "Content-Type": "application/json"
      },
      "body": {
        "username": "testUser",
        "password": "testPass"
      }
    }
  ],
  "rampUp": "5m"
}
Step 4: Set Load Parameters
Define parameters for your load test:
- Users: Specify the number of concurrent users to simulate.
- Duration: Set the duration for which the test should run.
- Pacing: Control the rate at which new users are introduced into the test.
Example:
{
  "load": {
    "users": 100,
    "duration": "10m",
    "pacing": "1s"
  }
}
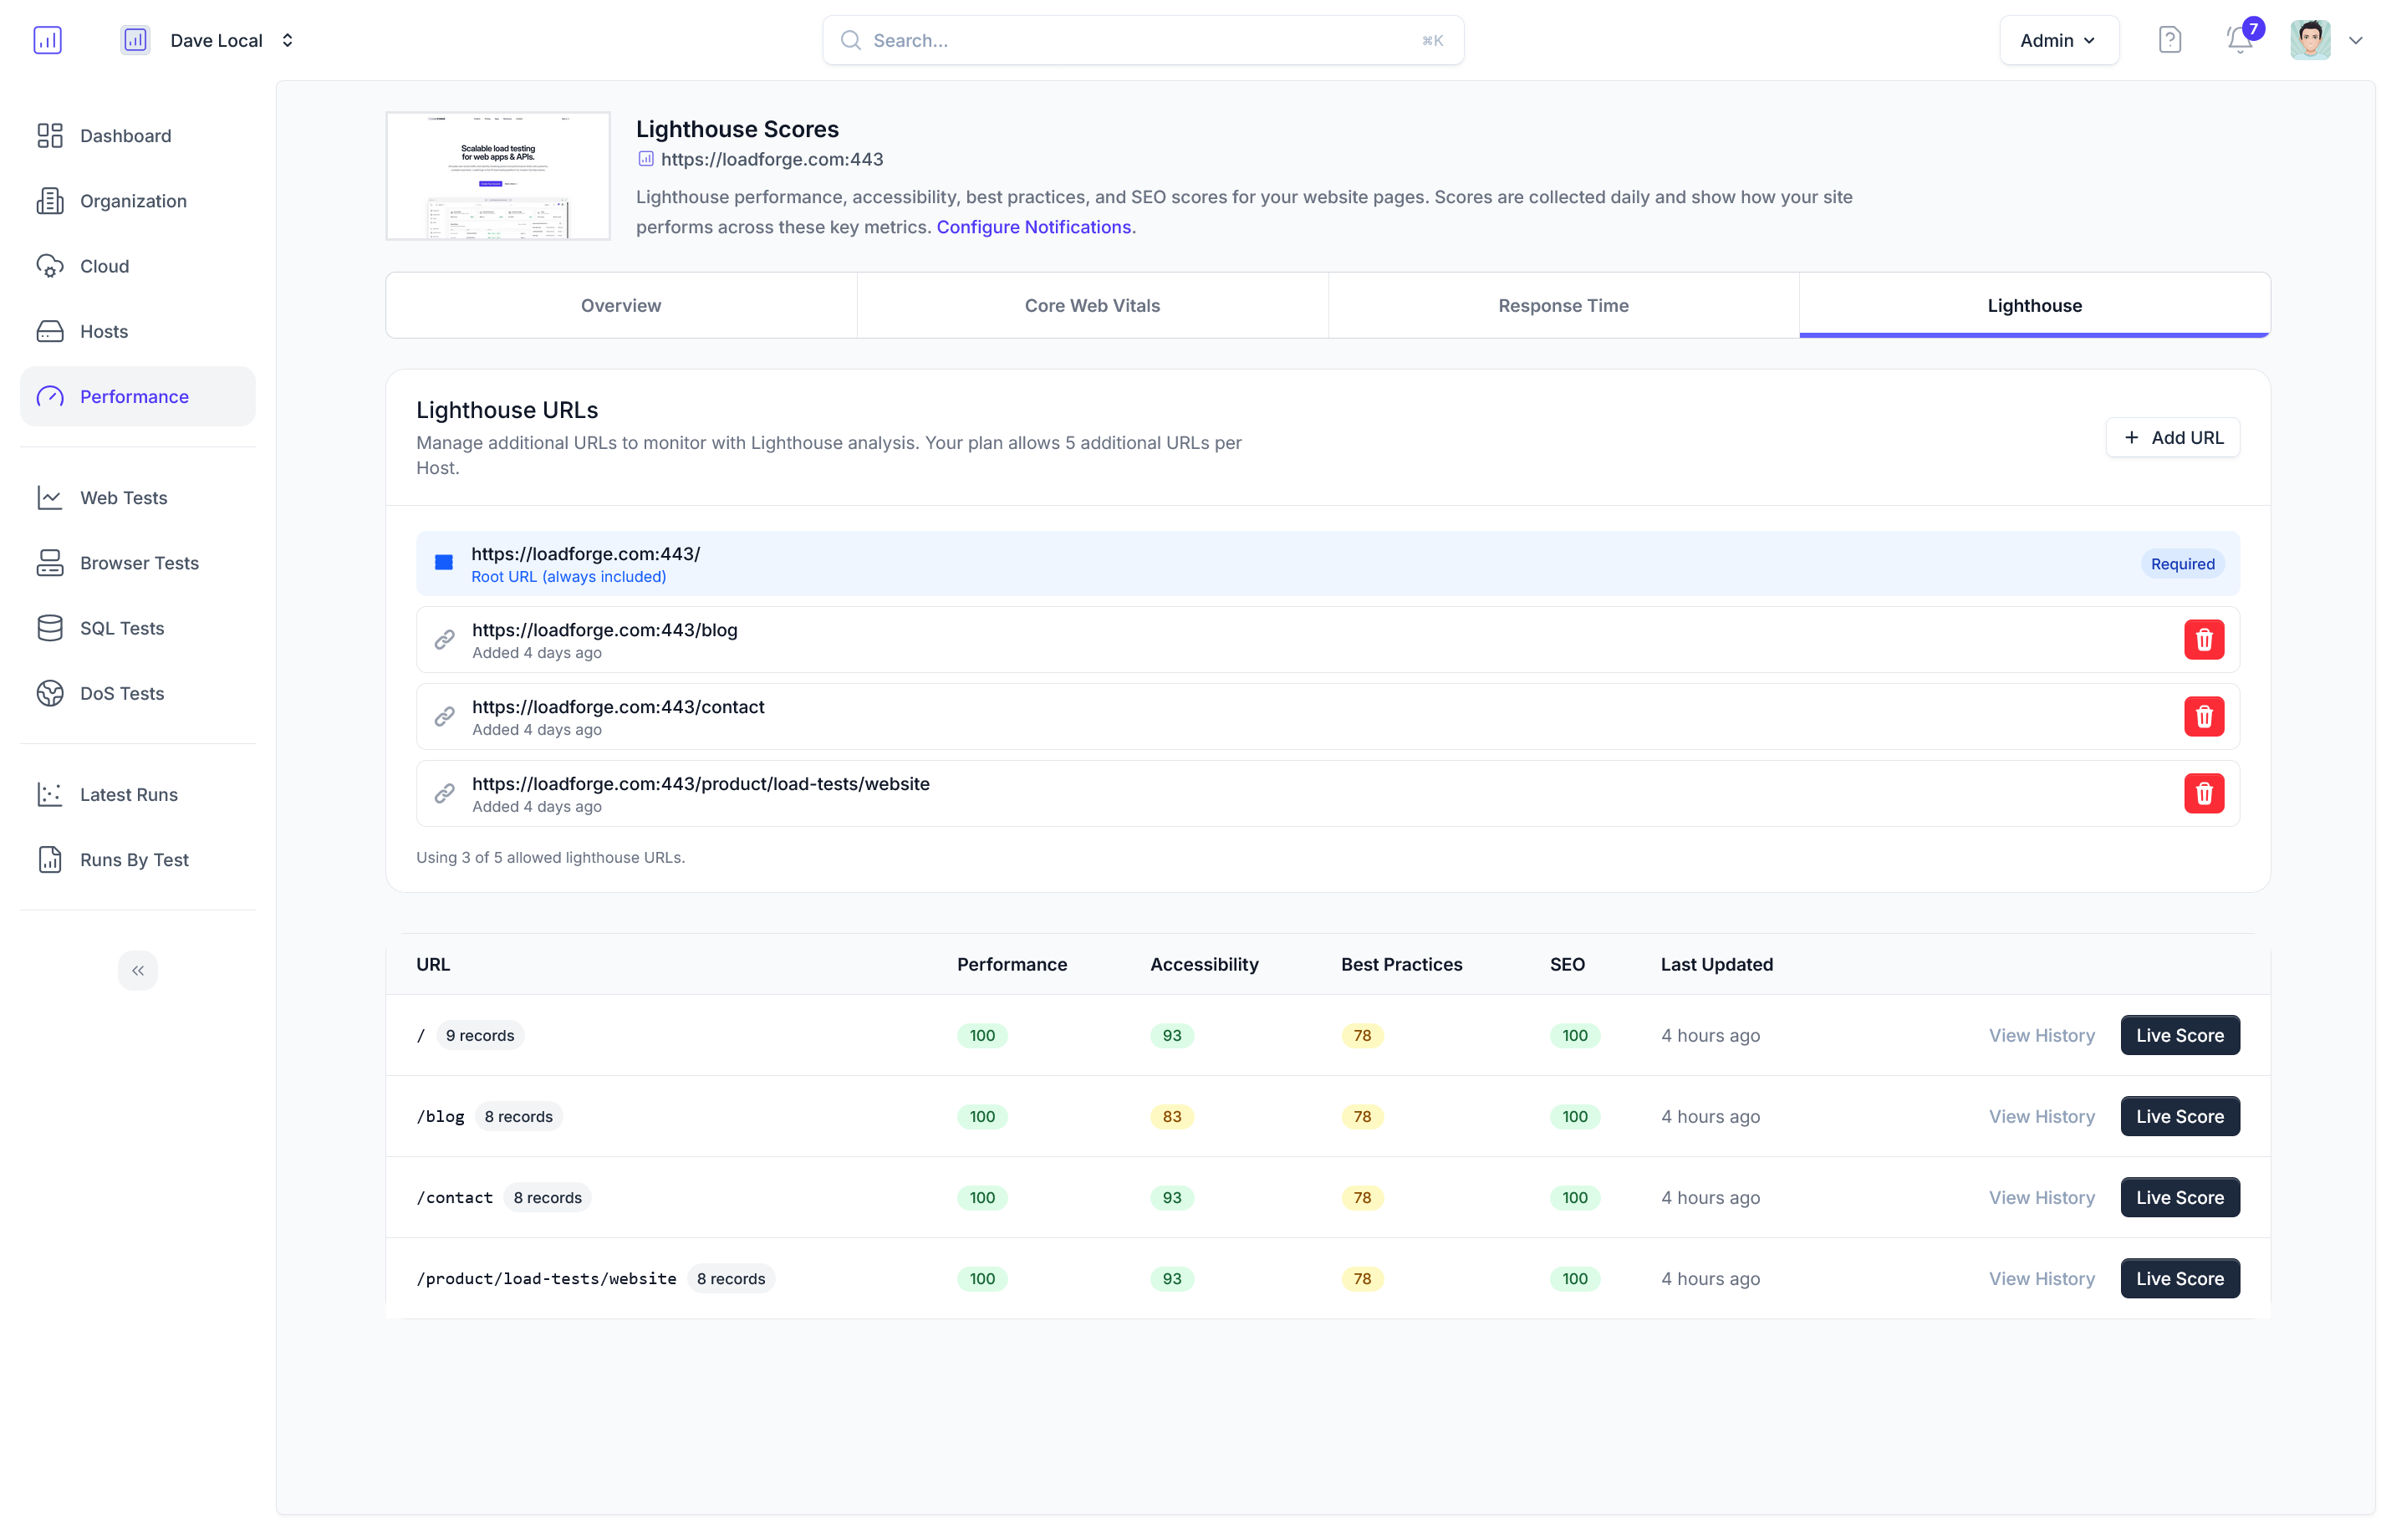
Step 5: Execute the Test
Once configured, execute the test by clicking the "Start Test" button. Monitor the test in real time through the LoadForge dashboard, which provides detailed metrics on response times, error rates, and throughput.
Step 6: Analyze Test Results
Post-execution, LoadForge will generate comprehensive reports:
- Response Time Distribution: Visualize how response times vary under load.
- Error Rates: Identify any increases in error rates, indicating possible issues.
- Resource Utilization: Monitor server CPU, memory, and disk usage to identify overworked resources.
Example graphical output:

Step 7: Identify and Mitigate Bottlenecks
Use the insights from the test to pinpoint performance bottlenecks. For instance, if the database shows high latency, consider indexing, query optimization, or scaling options. If CPU usage spikes, look into optimizing PHP scripts or app logic.
Conclusion
Load testing with LoadForge enables a thorough examination of your web stack's performance. By simulating real-world traffic, you can identify, diagnose, and address bottlenecks, ensuring that your application remains fast, reliable, and scalable under varying loads. Implementing load testing as part of your regular performance tuning strategy is crucial for long-term stability and user satisfaction.
Implementing Monitoring and Alerting Systems
In the context of performance optimization, real-time monitoring and alerting are paramount. Establishing a robust monitoring and alerting system helps you track key performance metrics, detect anomalies early, and take corrective actions before they impact users. Here, we introduce monitoring tools and techniques to help you set up an effective performance tracking and alerting framework for your web stack.
Choosing the Right Monitoring Tools
Selecting appropriate tools is the first step in implementing a monitoring and alerting system. Some popular choices include:
- Prometheus: For real-time monitoring and alerting with a powerful query language (PromQL).
- Grafana: For visualizing metrics from different sources, including Prometheus.
- Datadog: A comprehensive monitoring service for cloud-scale applications.
- New Relic: Provides end-to-end, real-time monitoring for your entire stack.
Key Metrics to Monitor
Each component of your web stack has specific metrics that need to be monitored closely:
- Database: Query execution time, number of active connections, cache hit ratio, slow queries.
- Web Server: Response times, request rates, error rates, CPU and memory utilization.
- PHP: Script execution time, memory usage, number of processes, error logs.
- Application: API response times, number of requests per endpoint, user session durations, background job processing times.
Setting Up Real-Time Monitoring
Here’s how you can set up a basic monitoring system using Prometheus and Grafana for a LAMP stack (Linux, Apache, MySQL, PHP).
-
Install Prometheus:
# Download Prometheus
wget https://github.com/prometheus/prometheus/releases/download/v2.30.0/prometheus-2.30.0.linux-amd64.tar.gz
tar xvfz prometheus-2.30.0.linux-amd64.tar.gz
cd prometheus-2.30.0.linux-amd64

# Start Prometheus
./prometheus --config.file=prometheus.yml
-
Configure Prometheus:
Edit the prometheus.yml file to add your targets (e.g., your webserver and database).
scrape_configs:
  - job_name: 'webserver'
    static_configs:
      - targets: ['localhost:9090']

  - job_name: 'database'
    static_configs:
      - targets: ['localhost:3306']
-
Install Grafana:
# Add Grafana repository and install Grafana
sudo add-apt-repository "deb https://packages.grafana.com/oss/deb stable main"
sudo apt-get update
sudo apt-get install -y grafana

# Start Grafana
sudo systemctl start grafana-server
sudo systemctl enable grafana-server
-
Configure Grafana:
- Access Grafana at
http://localhost:3000 and log in.
- Add Prometheus as a data source.
- Create dashboards to visualize your metrics.
Setting Up Alerts
Alerts notify you of issues as soon as they occur. Prometheus and Grafana provide robust alerting capabilities.
-
Create Alert Rules in Prometheus:
Add the following to your prometheus.yml file:
alerting:
  alertmanagers:
    - static_configs:
        - targets: ['localhost:9093']

rule_files:
  - "alert.rules.yml"
Example of alert.rules.yml:
groups:
  - name: example
    rules:
      - alert: HighErrorRate
        expr: job:request_errors:rate5m{job="webserver"} > 0.05
        for: 5m
        labels:
          severity: 'critical'
        annotations:
          summary: 'High request error rate detected'
          description: 'The error rate is above 5% for the last 5 minutes'
-
Configure Alertmanager:
In alertmanager.yml configure how alerts are sent (e.g., via email, Slack):
route:
  receiver: 'team-email'

receivers:
  - name: 'team-email'
    email_configs:
      - to: 'team@example.com'
Continuous Monitoring and Proactive Resolution
Continuous monitoring allows you to:
- Proactively Identify Issues: Immediate detection and notification of performance degradations or anomalies.
- Correlate Metrics with Events: Understand the impact of deployments, traffic spikes, or backend changes on your system.
- Historical Analysis: Use historical data for trend analysis, forecasting, and capacity planning.
Setting up dashboard views tailored to different layers of your stack helps isolate issues quickly. Use drill-down capabilities to transition from high-level overviews to specific metrics and logs.
Conclusion
Implementing a comprehensive monitoring and alerting system fortifies your web stack against performance issues. Real-time metrics and proactive alerts not only help in quick issue resolution but also in maintaining optimal performance continuously. Start with the right tools, focus on key metrics, and regularly refine your monitoring strategies to achieve an agile and resilient web infrastructure.
Best Practices for Ongoing Performance Optimization
Ensuring optimal performance of your web stack is an ongoing task that requires diligence and consistent effort. The following best practices will help you maintain and continuously improve your system, delivering the best possible experience to your users.
Regular Performance Audits
Conduct periodic audits of your web stack to identify potential bottlenecks and areas for improvement. This should include a thorough analysis of database queries, web server configurations, PHP scripts, and application logic. Utilize performance profiling tools and analyze metrics to gain insights.
Keep Software Updated
Ensure that all components of your web stack, including the database, web server, PHP version, and application frameworks, are updated to their latest stable versions. New releases often contain performance improvements and crucial security updates.
Optimize Database Queries
Regularly review and optimize your database queries. Use tools like slow query logs to identify inefficient queries and leverage indexing to speed up data retrieval. Here is an example of how to enable slow query logging in MySQL:
SET GLOBAL slow_query_log = 'ON';
SET GLOBAL slow_query_log_file = '/var/log/mysql/slow.log';
SET GLOBAL long_query_time = 1; # Log queries longer than 1 second
Monitor and Analyze Key Metrics
Implement comprehensive monitoring and alerting systems to track key performance metrics in real time. Tools like Prometheus, Grafana, and ELK Stack can provide valuable insights. Monitor metrics such as:
- Server response times
- Database query performance
- CPU and memory usage
- Error rates and logs
Optimize PHP Code
Regularly profile your PHP code to identify bottlenecks and memory leaks. Use tools like Xdebug and Blackfire to pinpoint performance issues. Optimize loops, avoid unnecessary computations, and consider using opcode caching with solutions like OPcache.
Implement Caching Strategies
Utilize caching mechanisms to reduce load on your database and speed up content delivery. Implement server-side caching with tools like Redis or Memcached, and leverage client-side caching using HTTP headers such as Cache-Control and ETag.
Automate Load Testing
Routine load testing helps in understanding how your web stack performs under stress. Use LoadForge for comprehensive load testing to simulate real-world traffic and identify bottlenecks. Here's an example of setting up a basic load test with LoadForge:
{
  "config": {
    "targetUrl": "https://yourwebsite.com",
    "duration": 300,
    "concurrentUsers": 100
  }
}
Implement Asynchronous Processing
Reduce response times by offloading heavy or long-running tasks to background processes. Make use of task queues such as RabbitMQ or Celery to handle asynchronous processing efficiently.
Adopt a Proactive Performance Management Approach
Proactively manage performance by setting up alerts and thresholds for critical metrics. Ensure alerts are actionable and guide immediate remediation steps. Regularly review and refine these thresholds as your application evolves.
Documentation and Knowledge Sharing
Maintain detailed documentation of your performance optimization efforts and share insights with your team. Promoting a culture of knowledge sharing helps in staying ahead of potential issues and fosters continuous improvement.
Conduct Code Reviews and Pair Programming
Encourage regular code reviews and pair programming sessions with a focus on performance best practices. This ensures that performance considerations are an integral part of your development process.
By adopting these best practices, you can ensure the sustained performance of your web stack, providing a smoother and more reliable experience for your users. Regular audits, proactive management, and continuous improvement are key to long-term success.
Conclusion
In this comprehensive guide, we have explored the various facets of diagnosing and resolving slowdowns in your web stack. Whether you're dealing with database performance issues, web server bottlenecks, PHP inefficiencies, or application-level slowdowns, identifying the root cause is crucial for effective performance tuning. Here’s a brief recap of the key points discussed:
-
Identifying Database Performance Issues:
- High query times and connection bottlenecks are signs of database slowdowns.
- Utilize tools like slow query logs and indexing strategies to monitor and optimize performance.
-
Diagnosing Web Server Slowdowns:
- Look for high response times, server load, and error rates to identify web server issues.
- Adjust configurations and allocate resources efficiently to tune web server performance.
-
Evaluating PHP Performance:
- Common PHP bottlenecks include inefficient code, memory leaks, and high CPU usage.
- Use profiling tools to identify slow parts and optimize PHP scripts for better execution speed.
-
Analyzing Application-Level Bottlenecks:
- Detecting performance issues within the application logic is essential.
- Employ best practices such as code optimization, asynchronous processing, and designing efficient algorithms.
-
Using LoadForge for Comprehensive Load Testing:
- Load testing is vital for diagnosing performance issues.
- LoadForge can simulate real-world traffic, helping you identify bottlenecks and assess overall system performance.
-
Implementing Monitoring and Alerting Systems:
- Real-time performance tracking and alerts are indispensable.
- Continuous monitoring ensures proactive issue resolution and helps maintain optimal performance.
-
Best Practices for Ongoing Performance Optimization:
- Regular audits, updates, and proactive performance management are essential.
- Follow a systematic approach to continuously improve web stack performance.
Adopting a systematic approach to performance optimization not only ensures immediate issue resolution but also contributes to the sustainable long-term health of your web stack. Regular monitoring, proactive tuning, and load testing with tools like LoadForge will help maintain a high-performing and reliable online presence.
By adhering to the best practices discussed, you can preemptively identify potential issues, optimize your resources efficiently, and provide a smooth and responsive user experience. Remember, performance optimization is an ongoing process that requires diligence, regular assessments, and timely interventions.
Together, these steps form a holistic approach to web stack performance management, ensuring that your web applications run smoothly under varying loads and use cases. As you continue to hone your performance tuning skills, your ability to deliver robust and efficient web services will grow, benefiting both your users and your business.