Load testing analytics: find bottlenecks in seconds
LoadForge surfaces P95/P99 latency, error bursts, and AI-generated fix recommendations in real time — so your team ships faster with every test run.
Trusted by 2,400+ teams worldwide.
https://loadforge.com/product/reporting
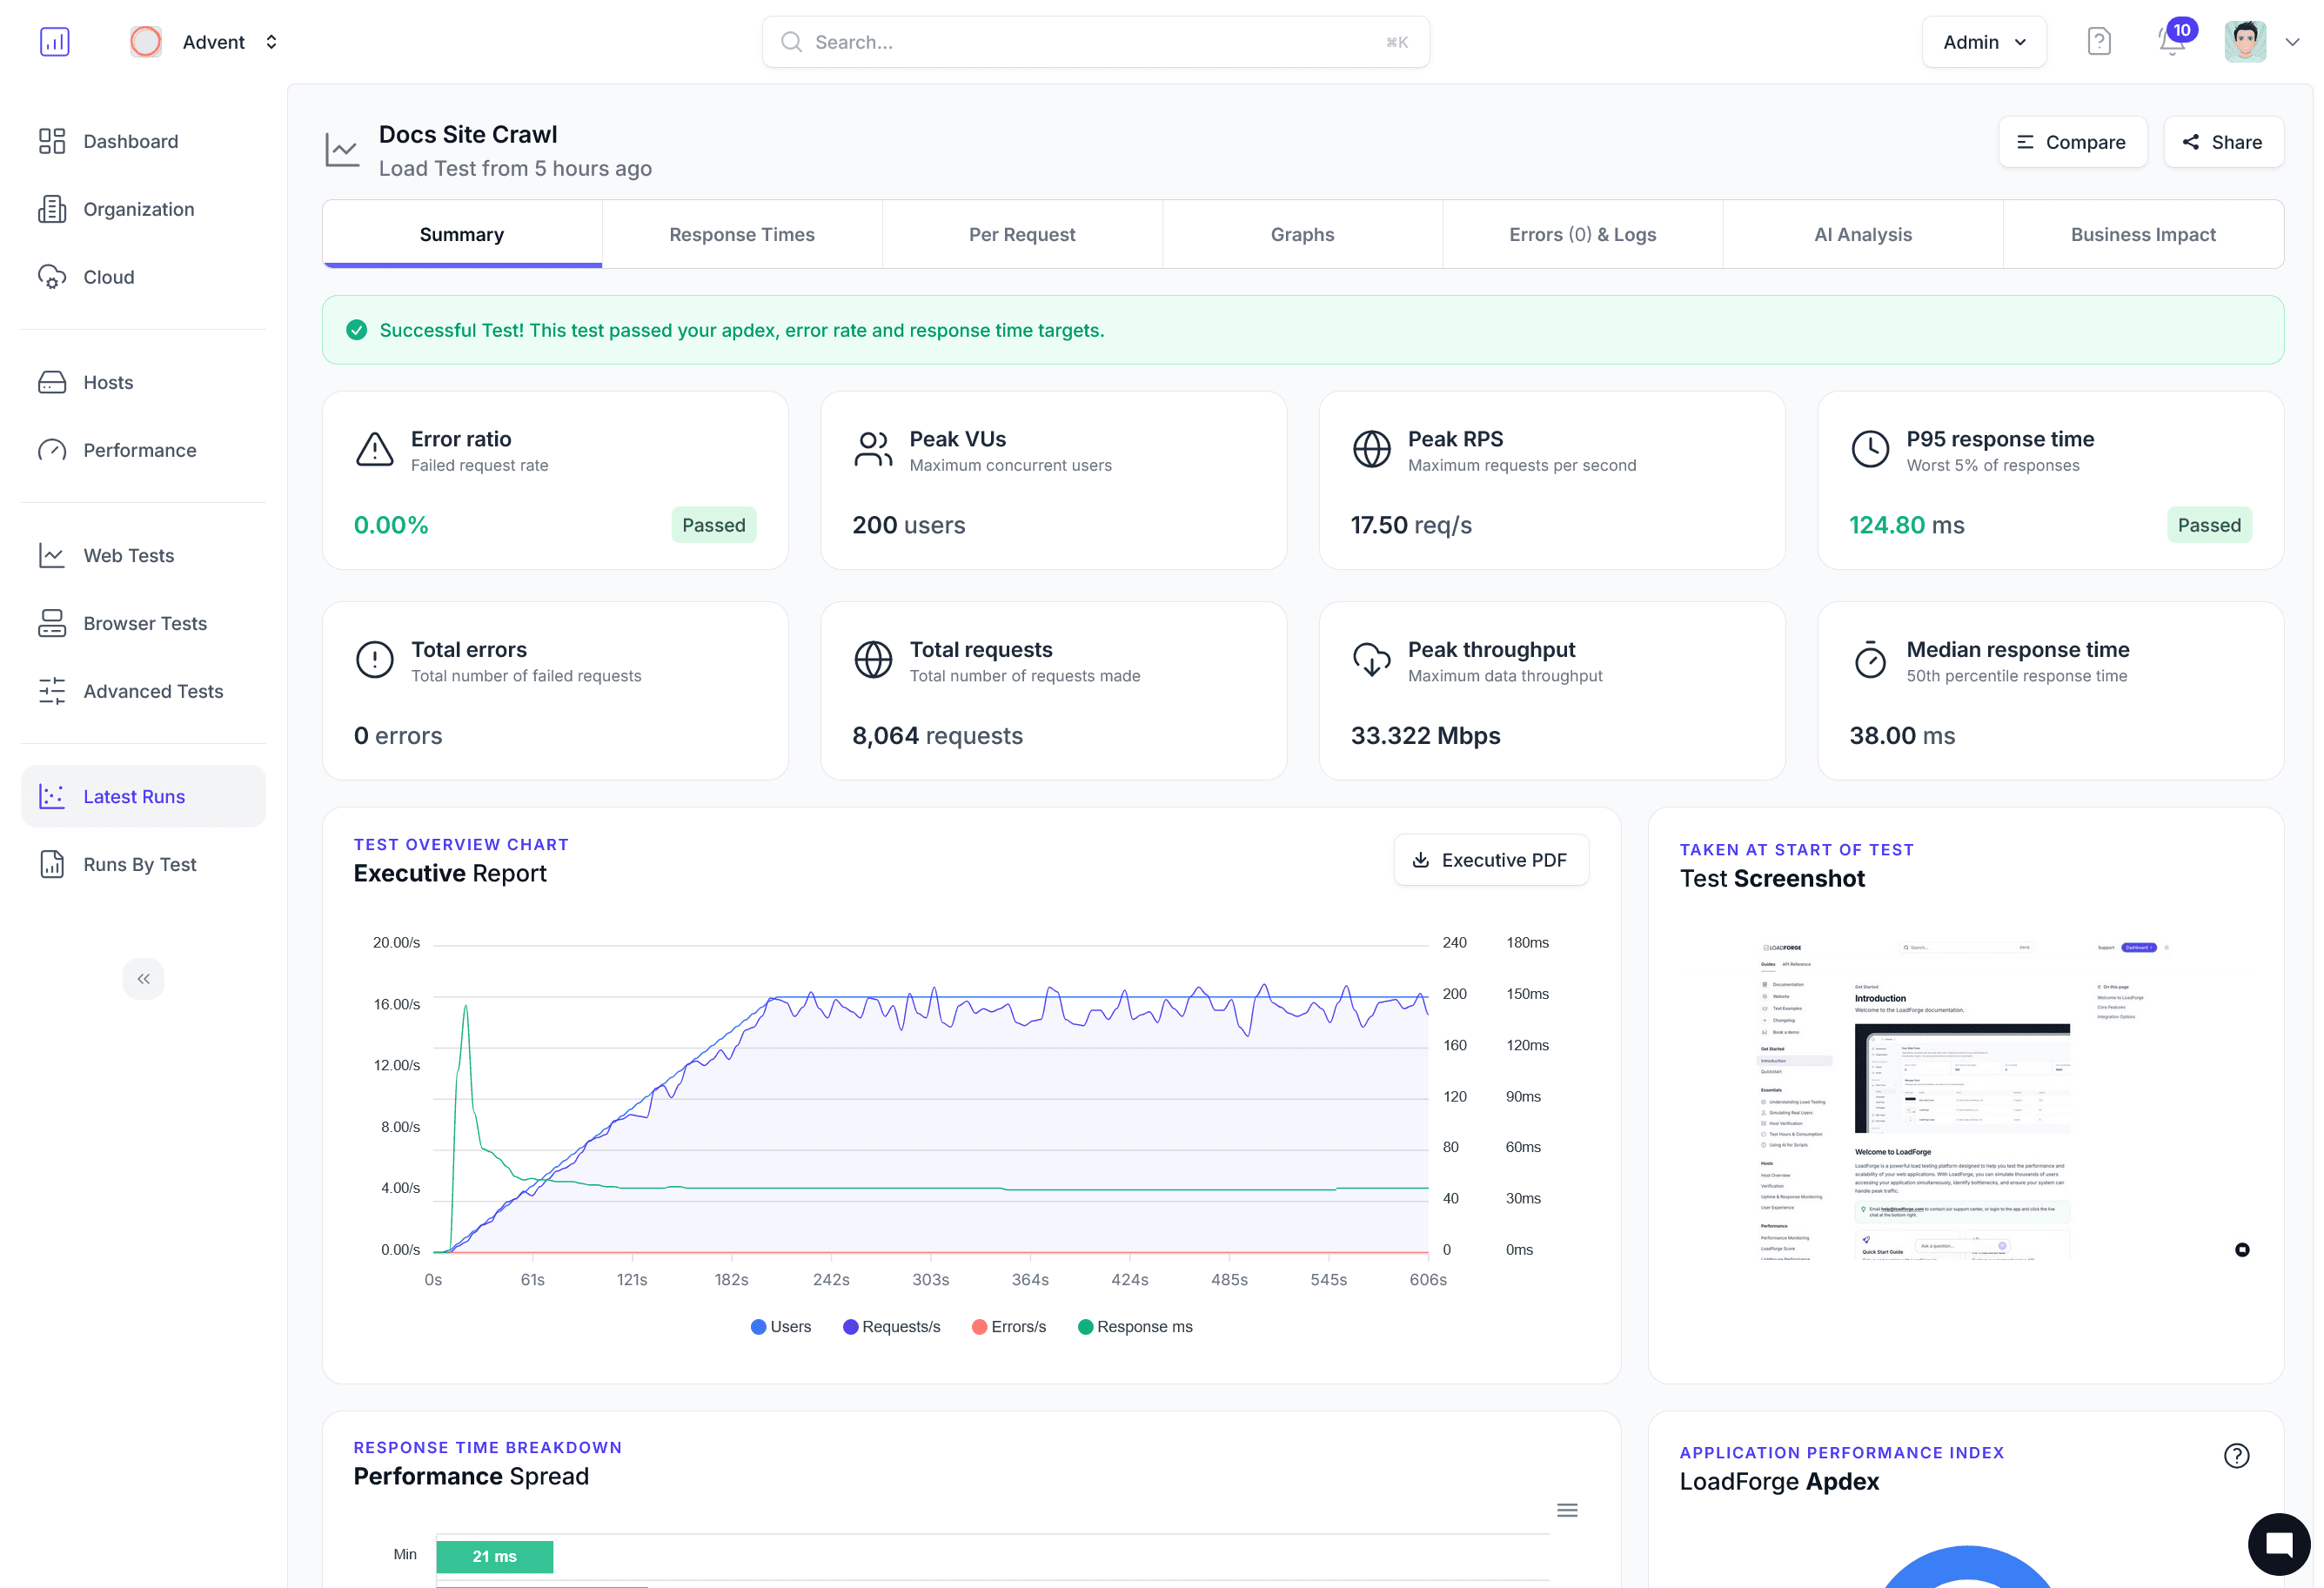
AI reporting that explains every spike
Drive confident decisions with LoadForge Copilot. Each report pairs percentile charts with plain-language summaries, action plans, and risk scoring.
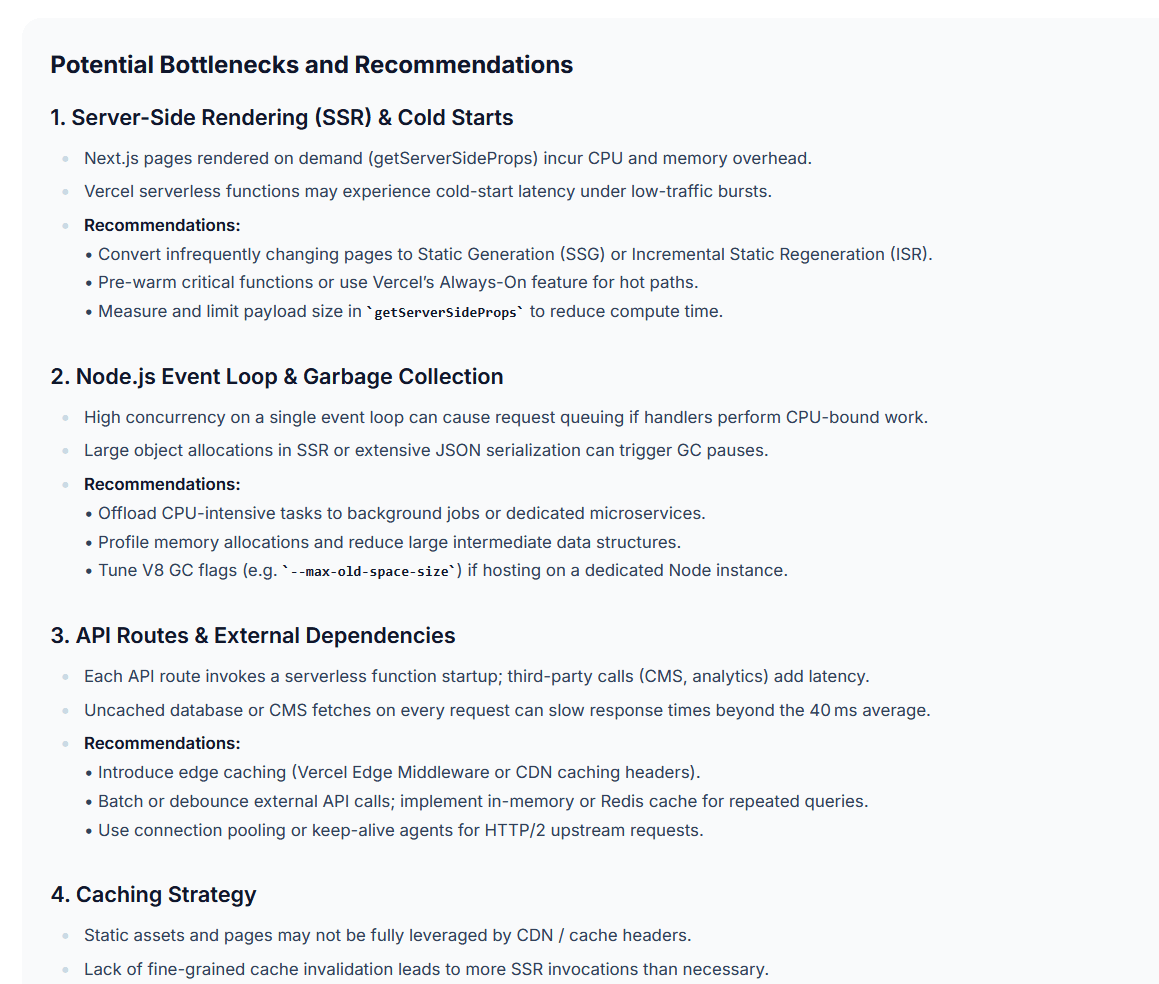
AI summaries that understand your stack
Digest every run with narrative reports that explain failed checks, quantify impact, and recommend next actions for engineers and stakeholders.
Auto-correlated alerts
Let LoadForge correlate latency spikes with error bursts, host telemetry, and release events so you know exactly where to start tuning.
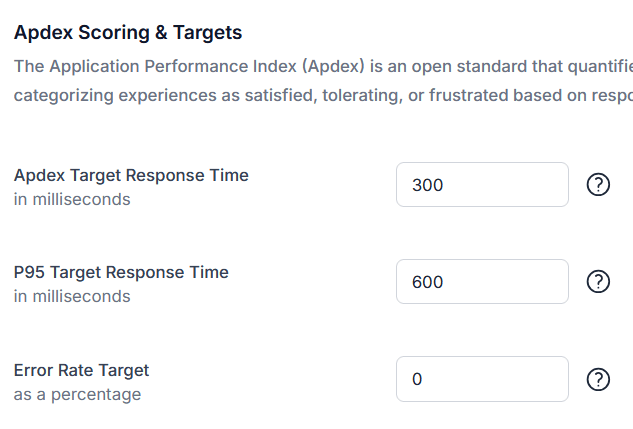
Guardrails for production SLAs
Define guardrails once. AI keeps watch across scheduled tests, flags breaches, and suggests adjustments before they become incidents.
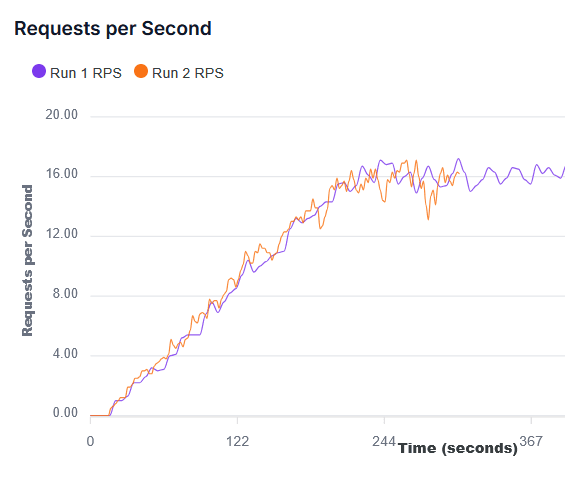
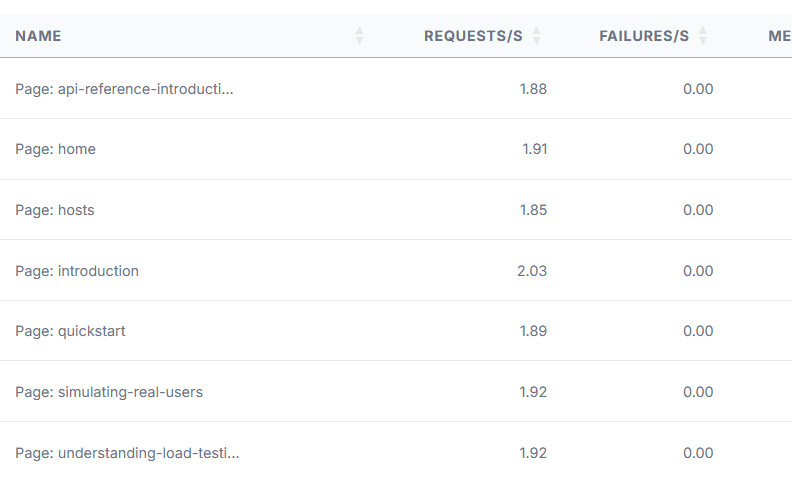
Adaptive run comparisons
Stack new results against baselines automatically, highlighting what changed, what held steady, and where regression risks are emerging.
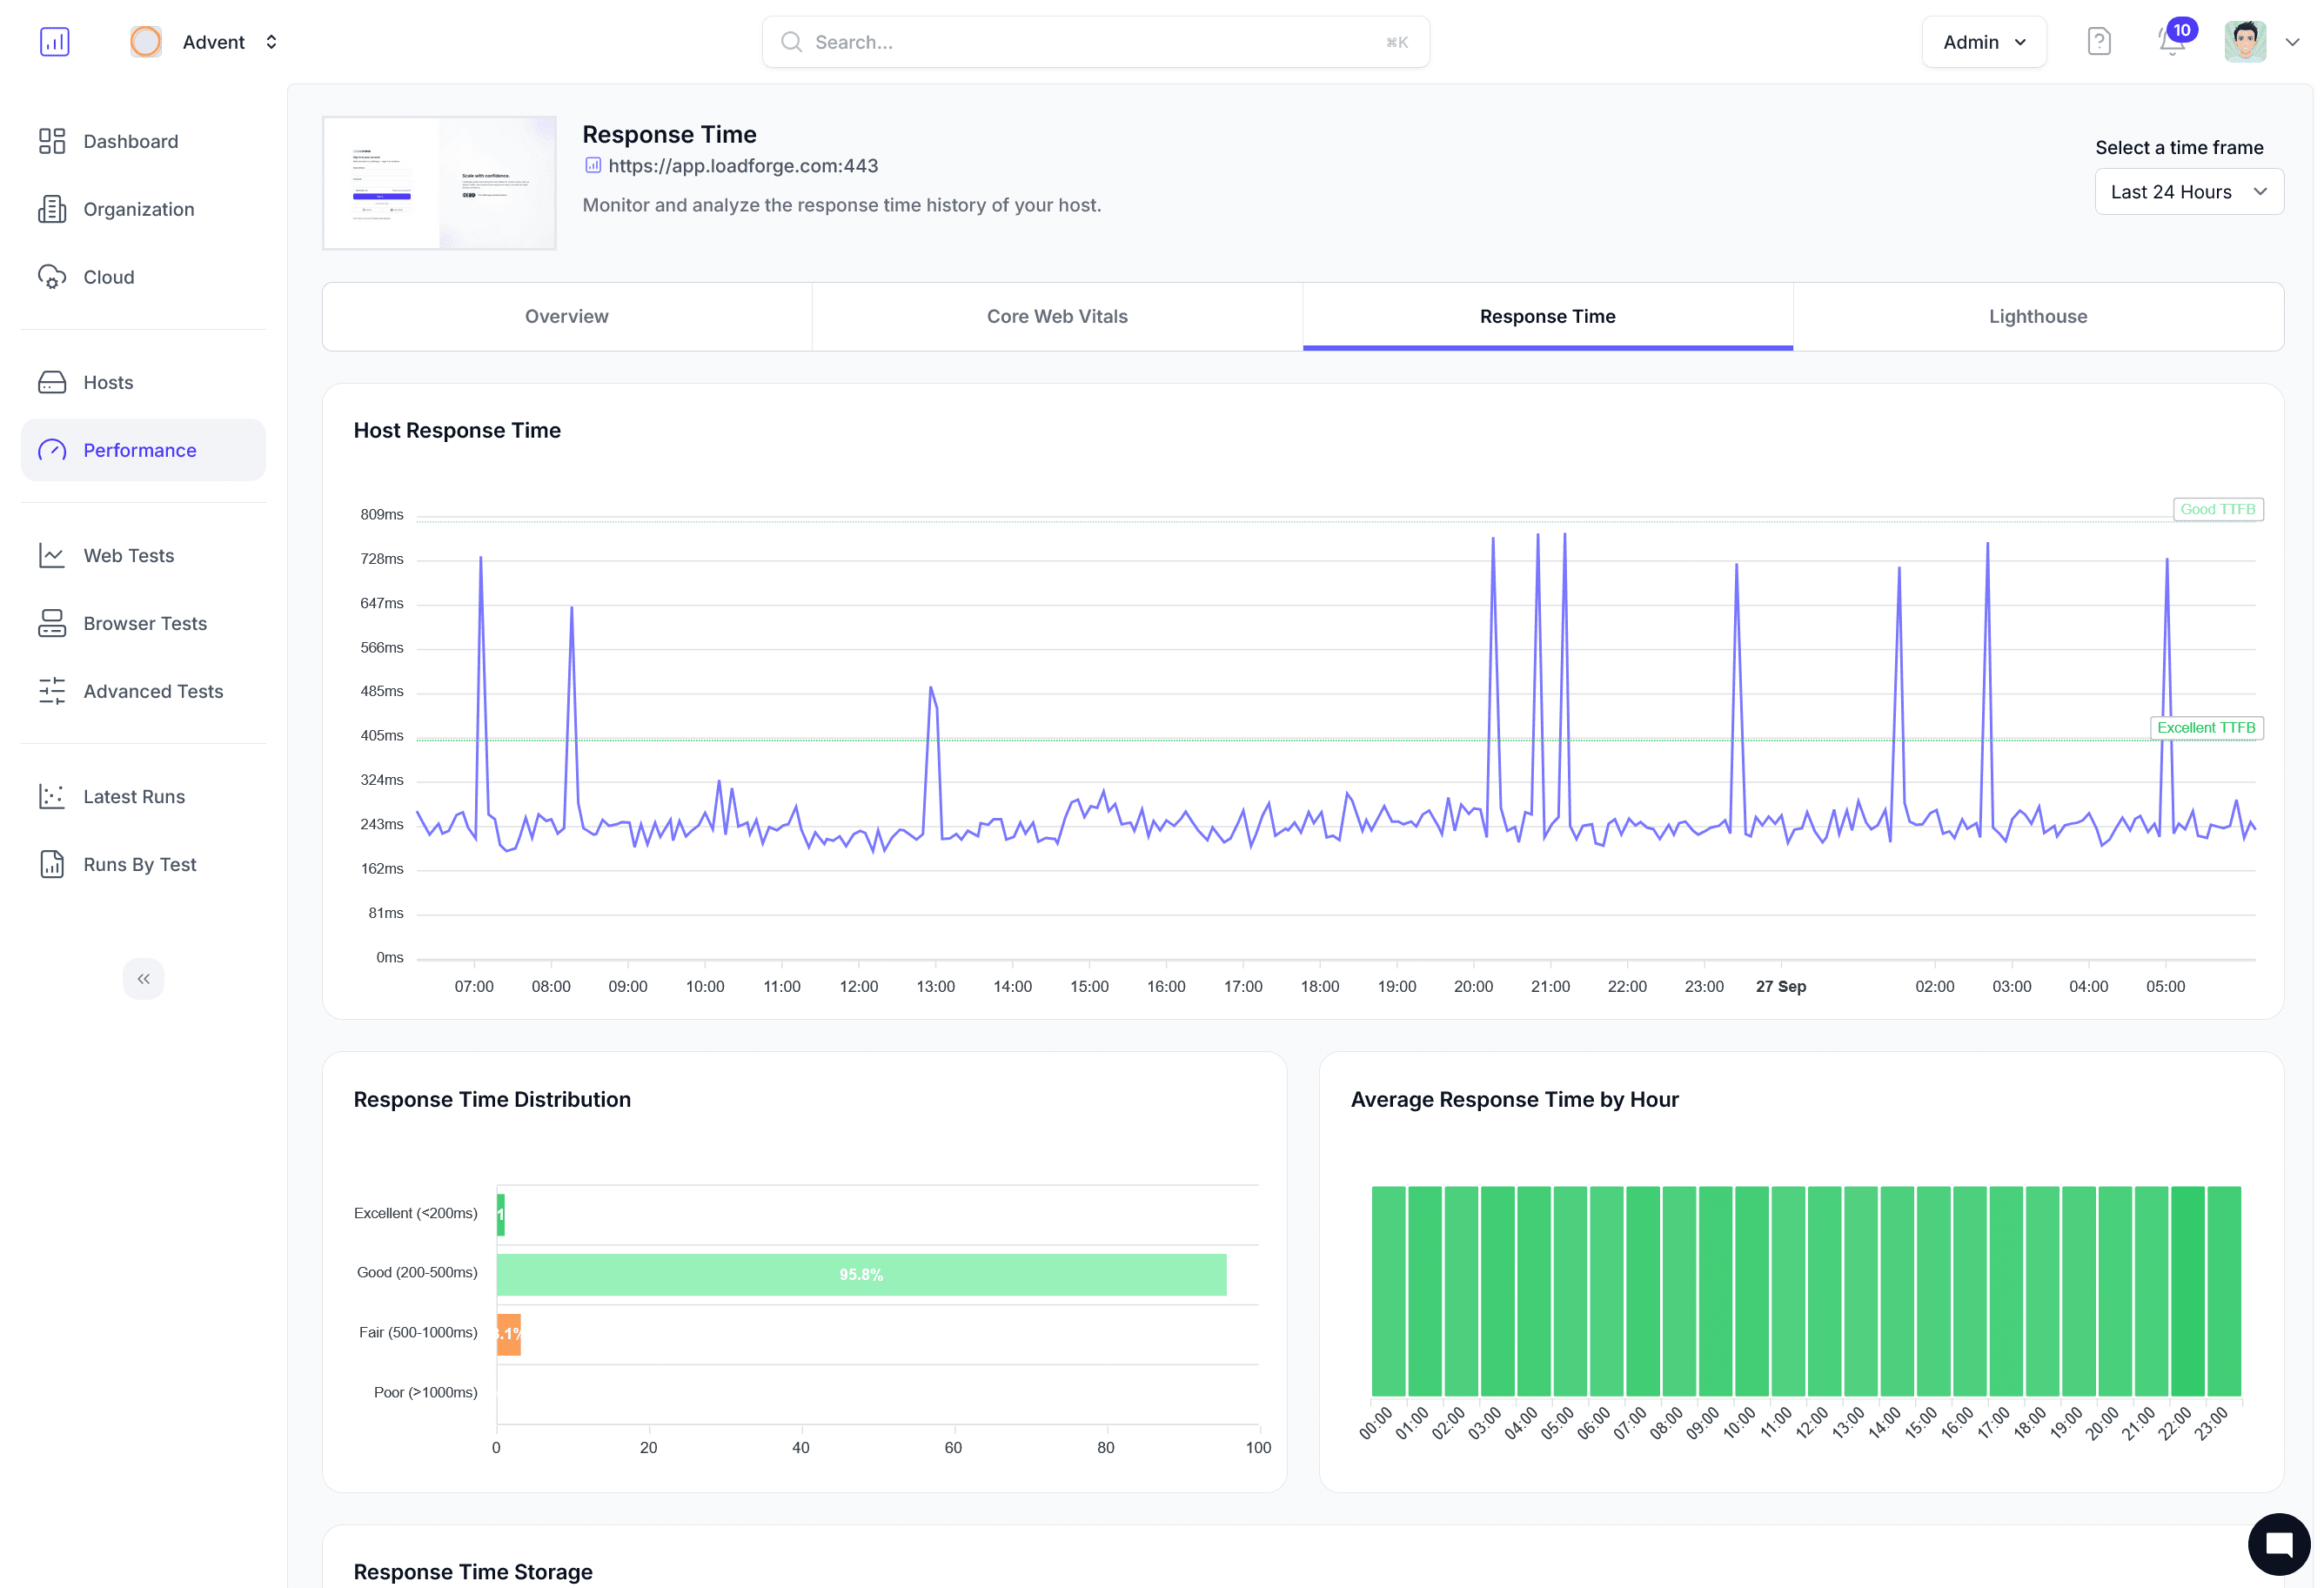
Global signals, local context
Blend real-user telemetry, Core Web Vitals, and synthetic load to see regional impacts and prioritize the fixes that move the needle.
See your first report in under 5 minutes
Sign up and run a free load test to get a full AI-powered report with percentile breakdowns and actionable recommendations.
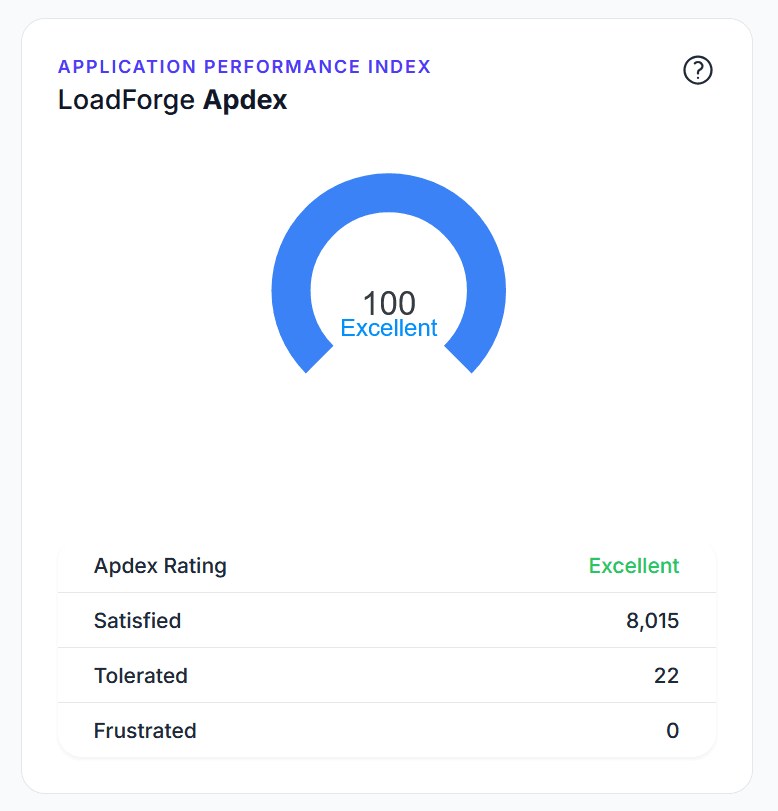
AI Metrics
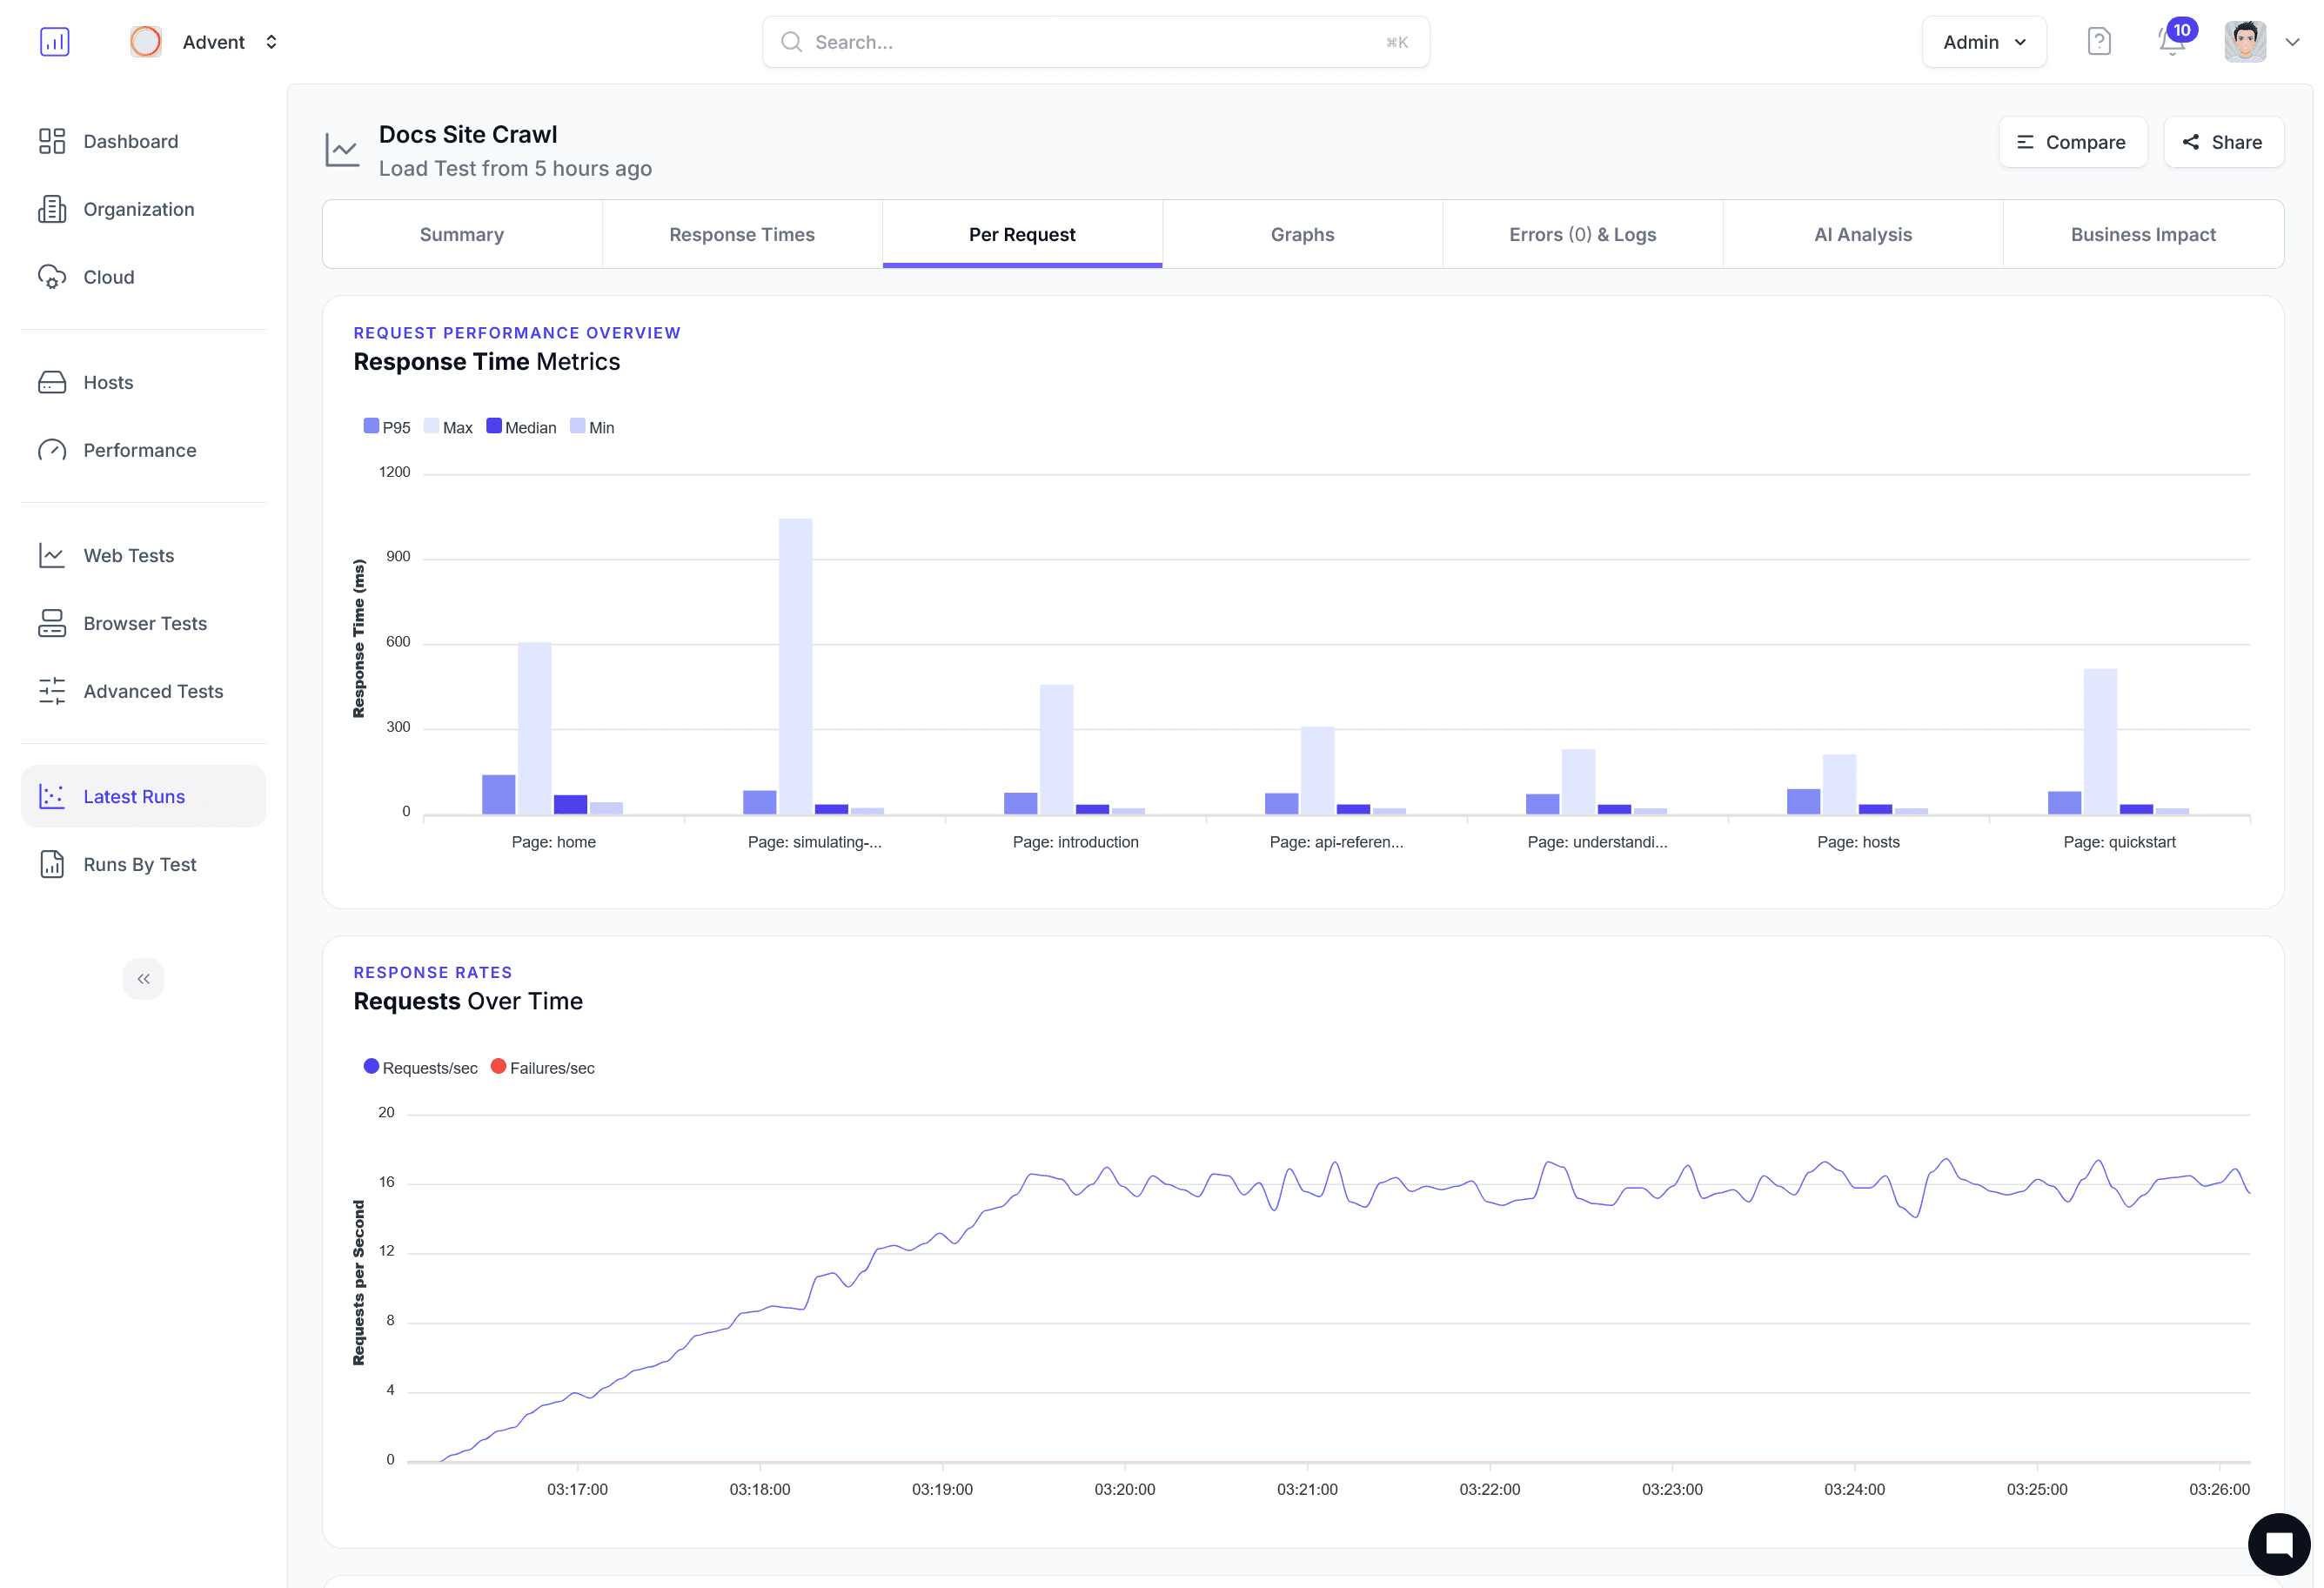
Capture and trend the signals that matter
Correlate percentile shifts, anomaly spikes, and throughput swings in a single AI-ready timeline.
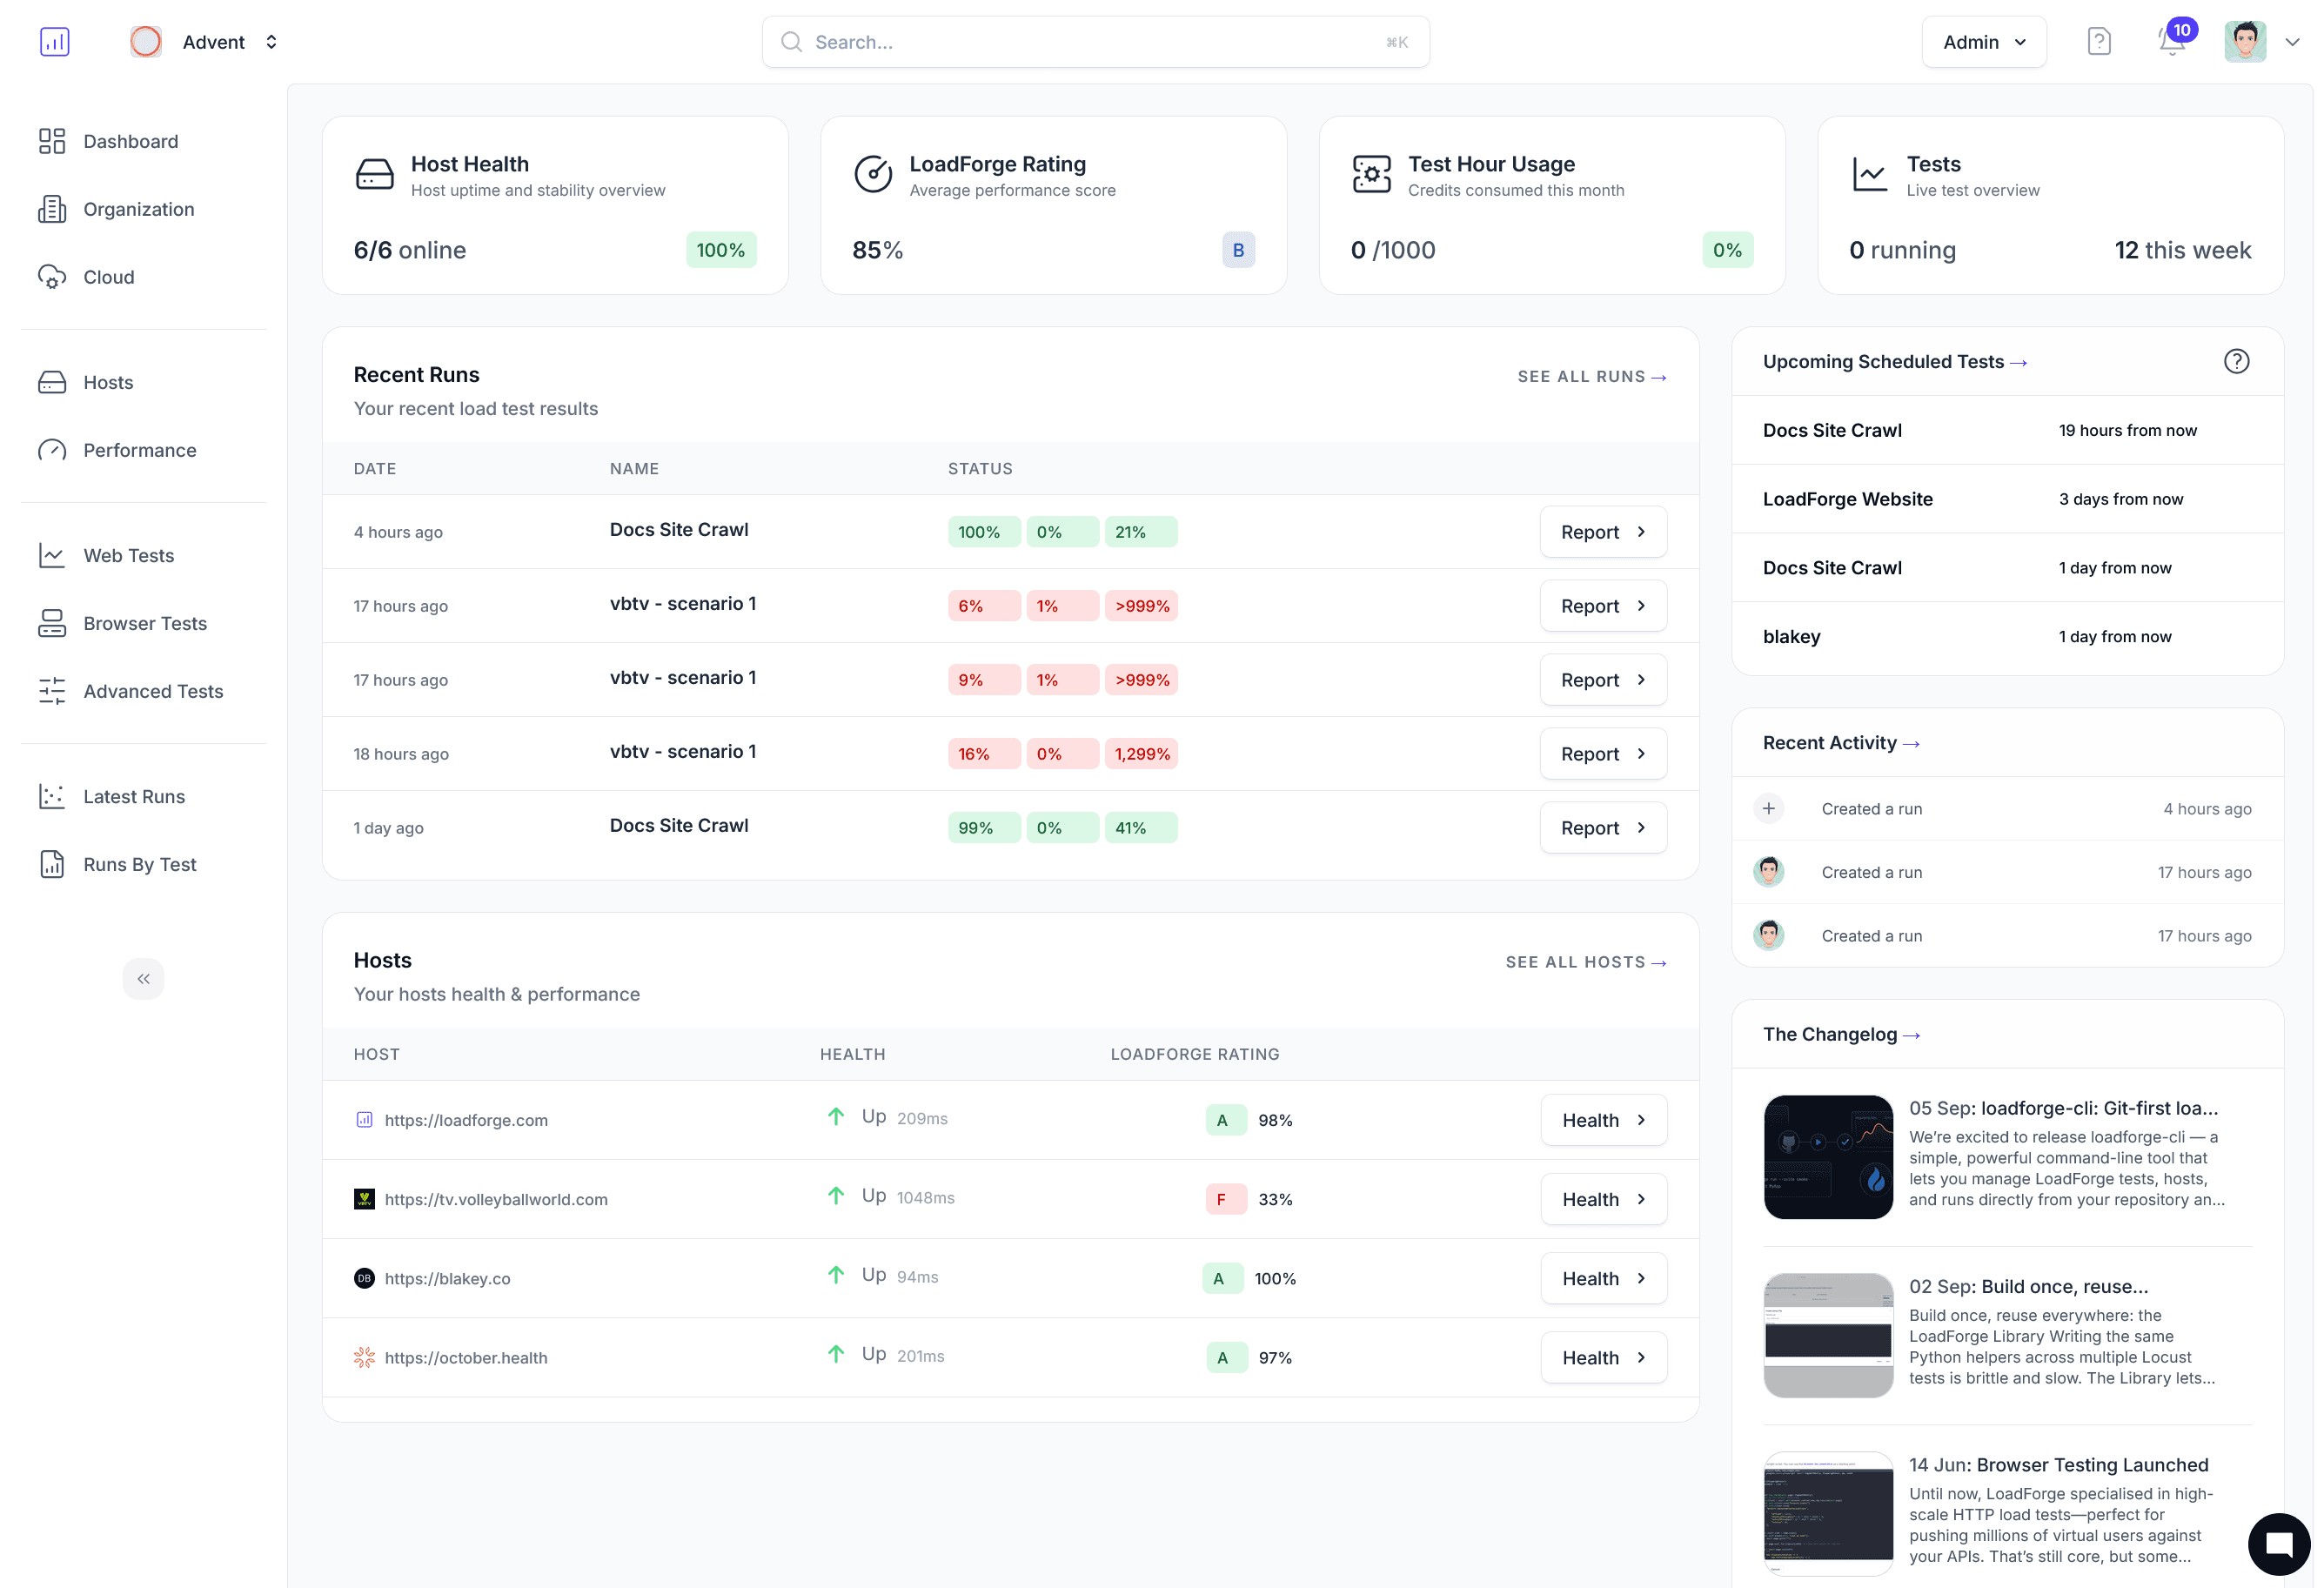
Compare runs
Compare any two or more runs to track changes in performance.
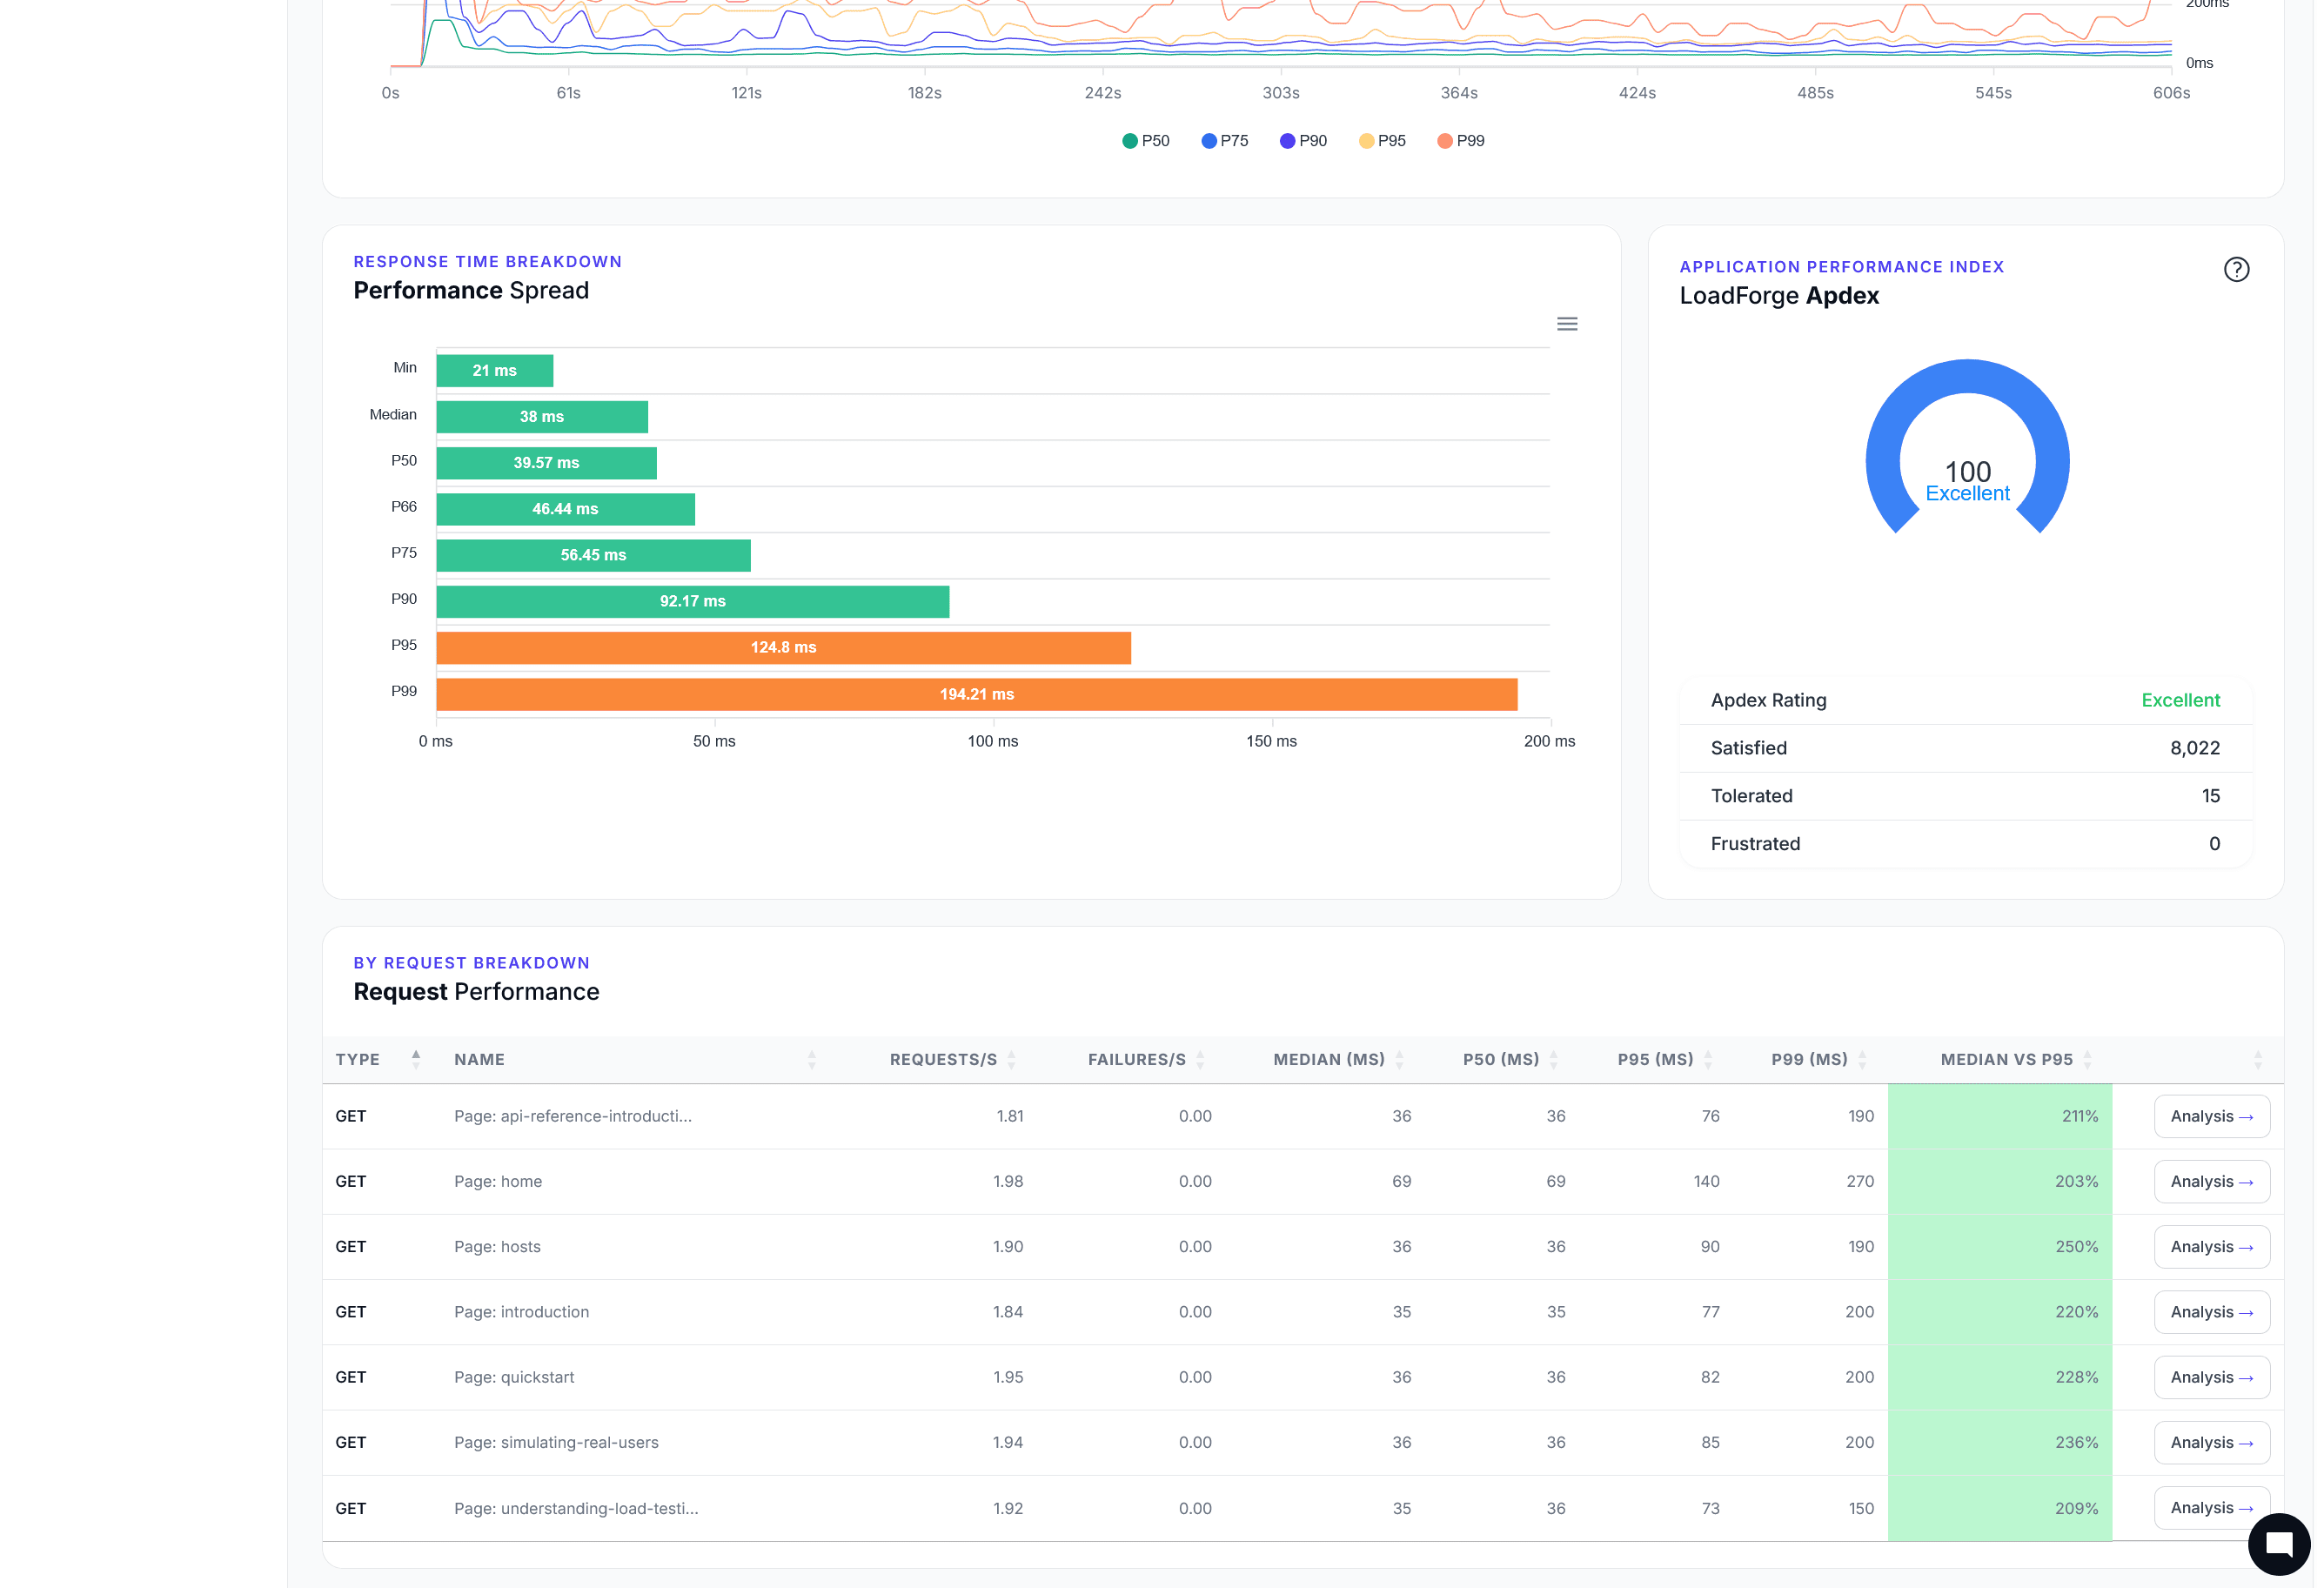
Latency tracking
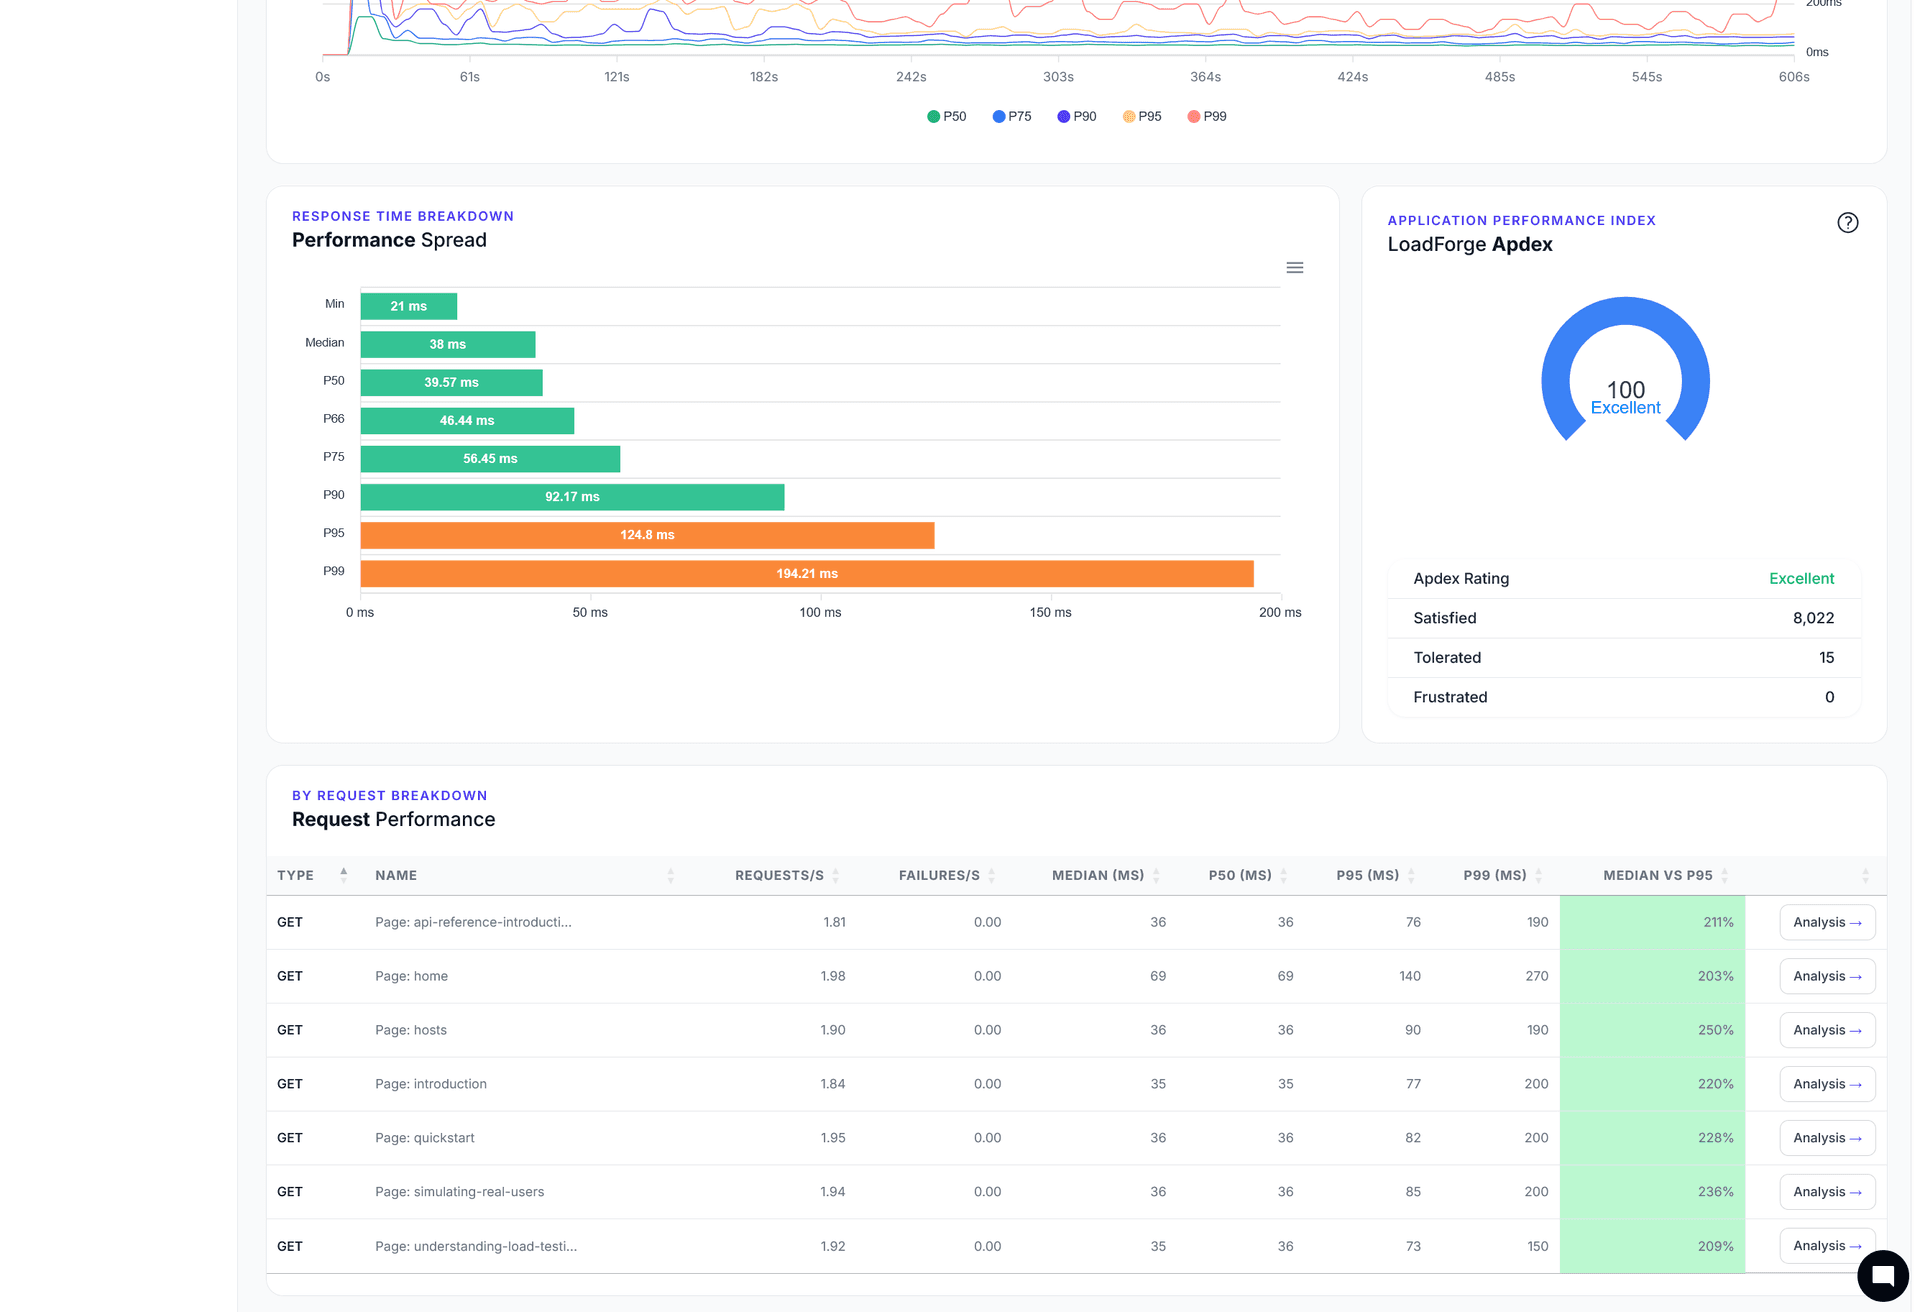
P50, P75, P90, P95, and P99 reporting surfaces edge cases instantly.
Anomaly detection
Automatically detect performance degradations and notify your team.
Reports that explain
what happened and what to do next
Legacy tools give you raw data. LoadForge gives you answers — complete analytics with AI-powered recommendations so your team spends time fixing, not interpreting.
Trusted by 2,400+ teams to understand their performance