Explorer reports addition
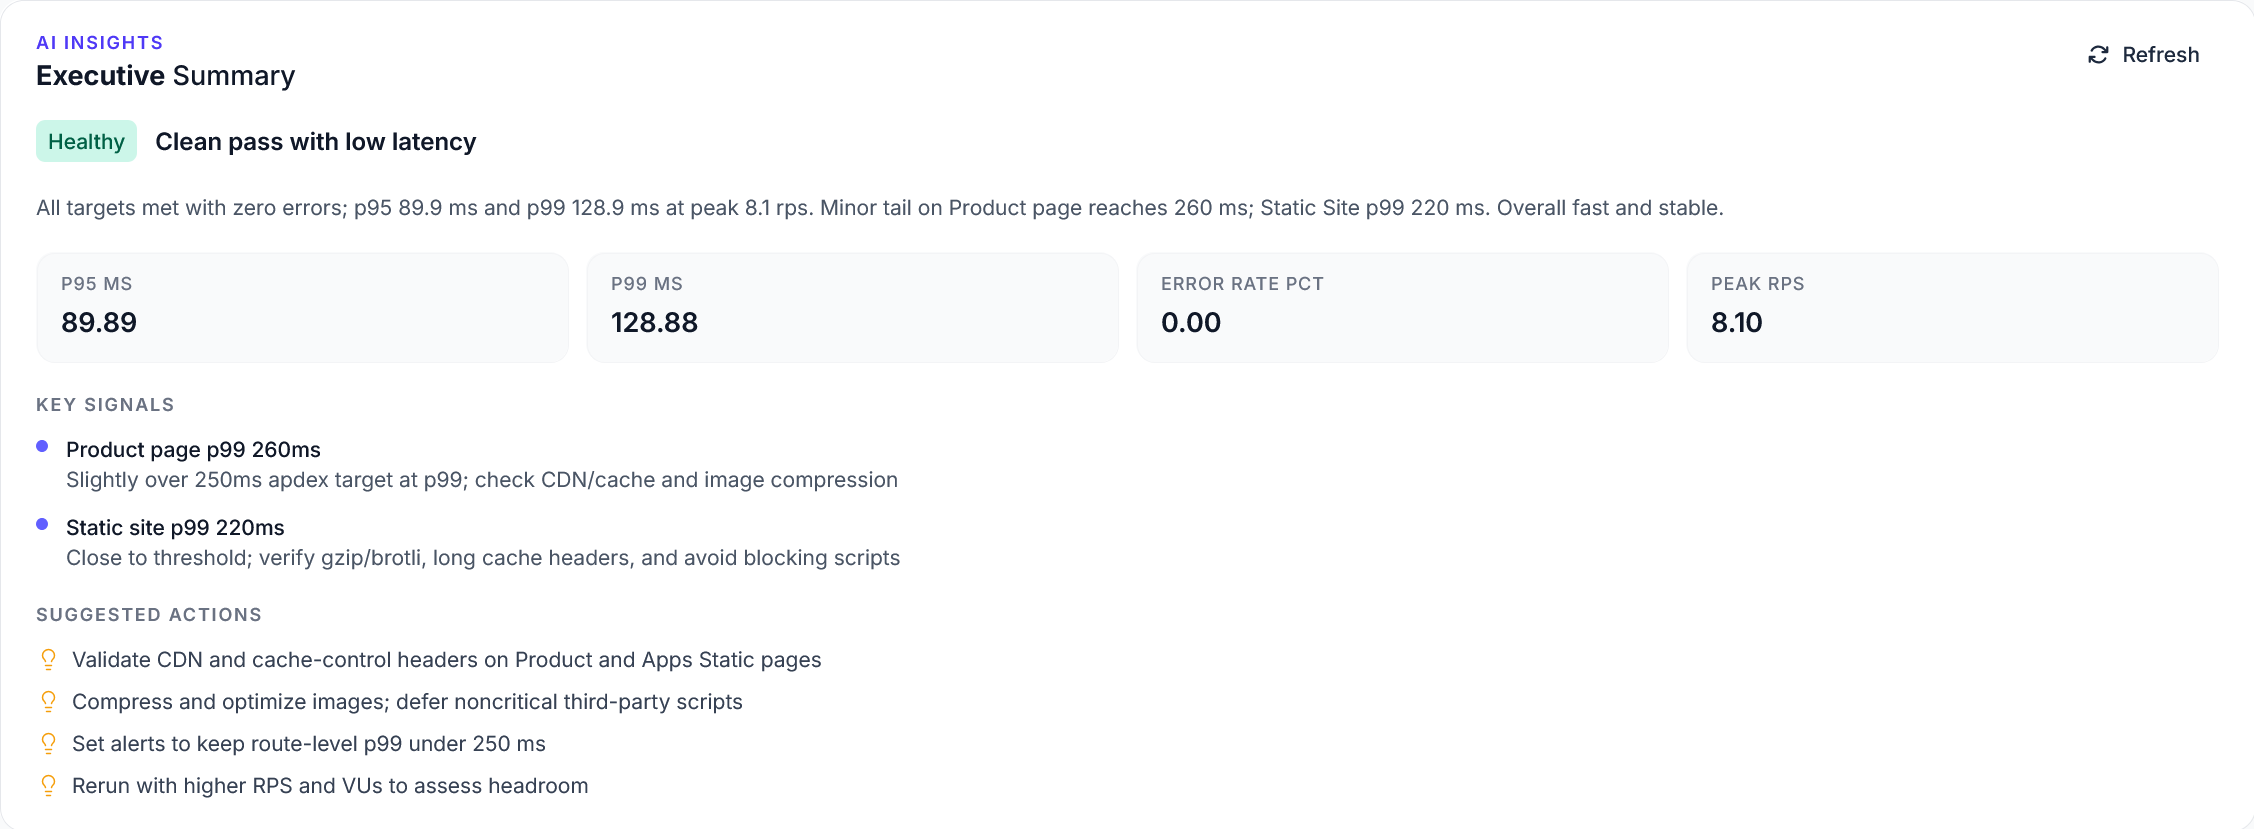
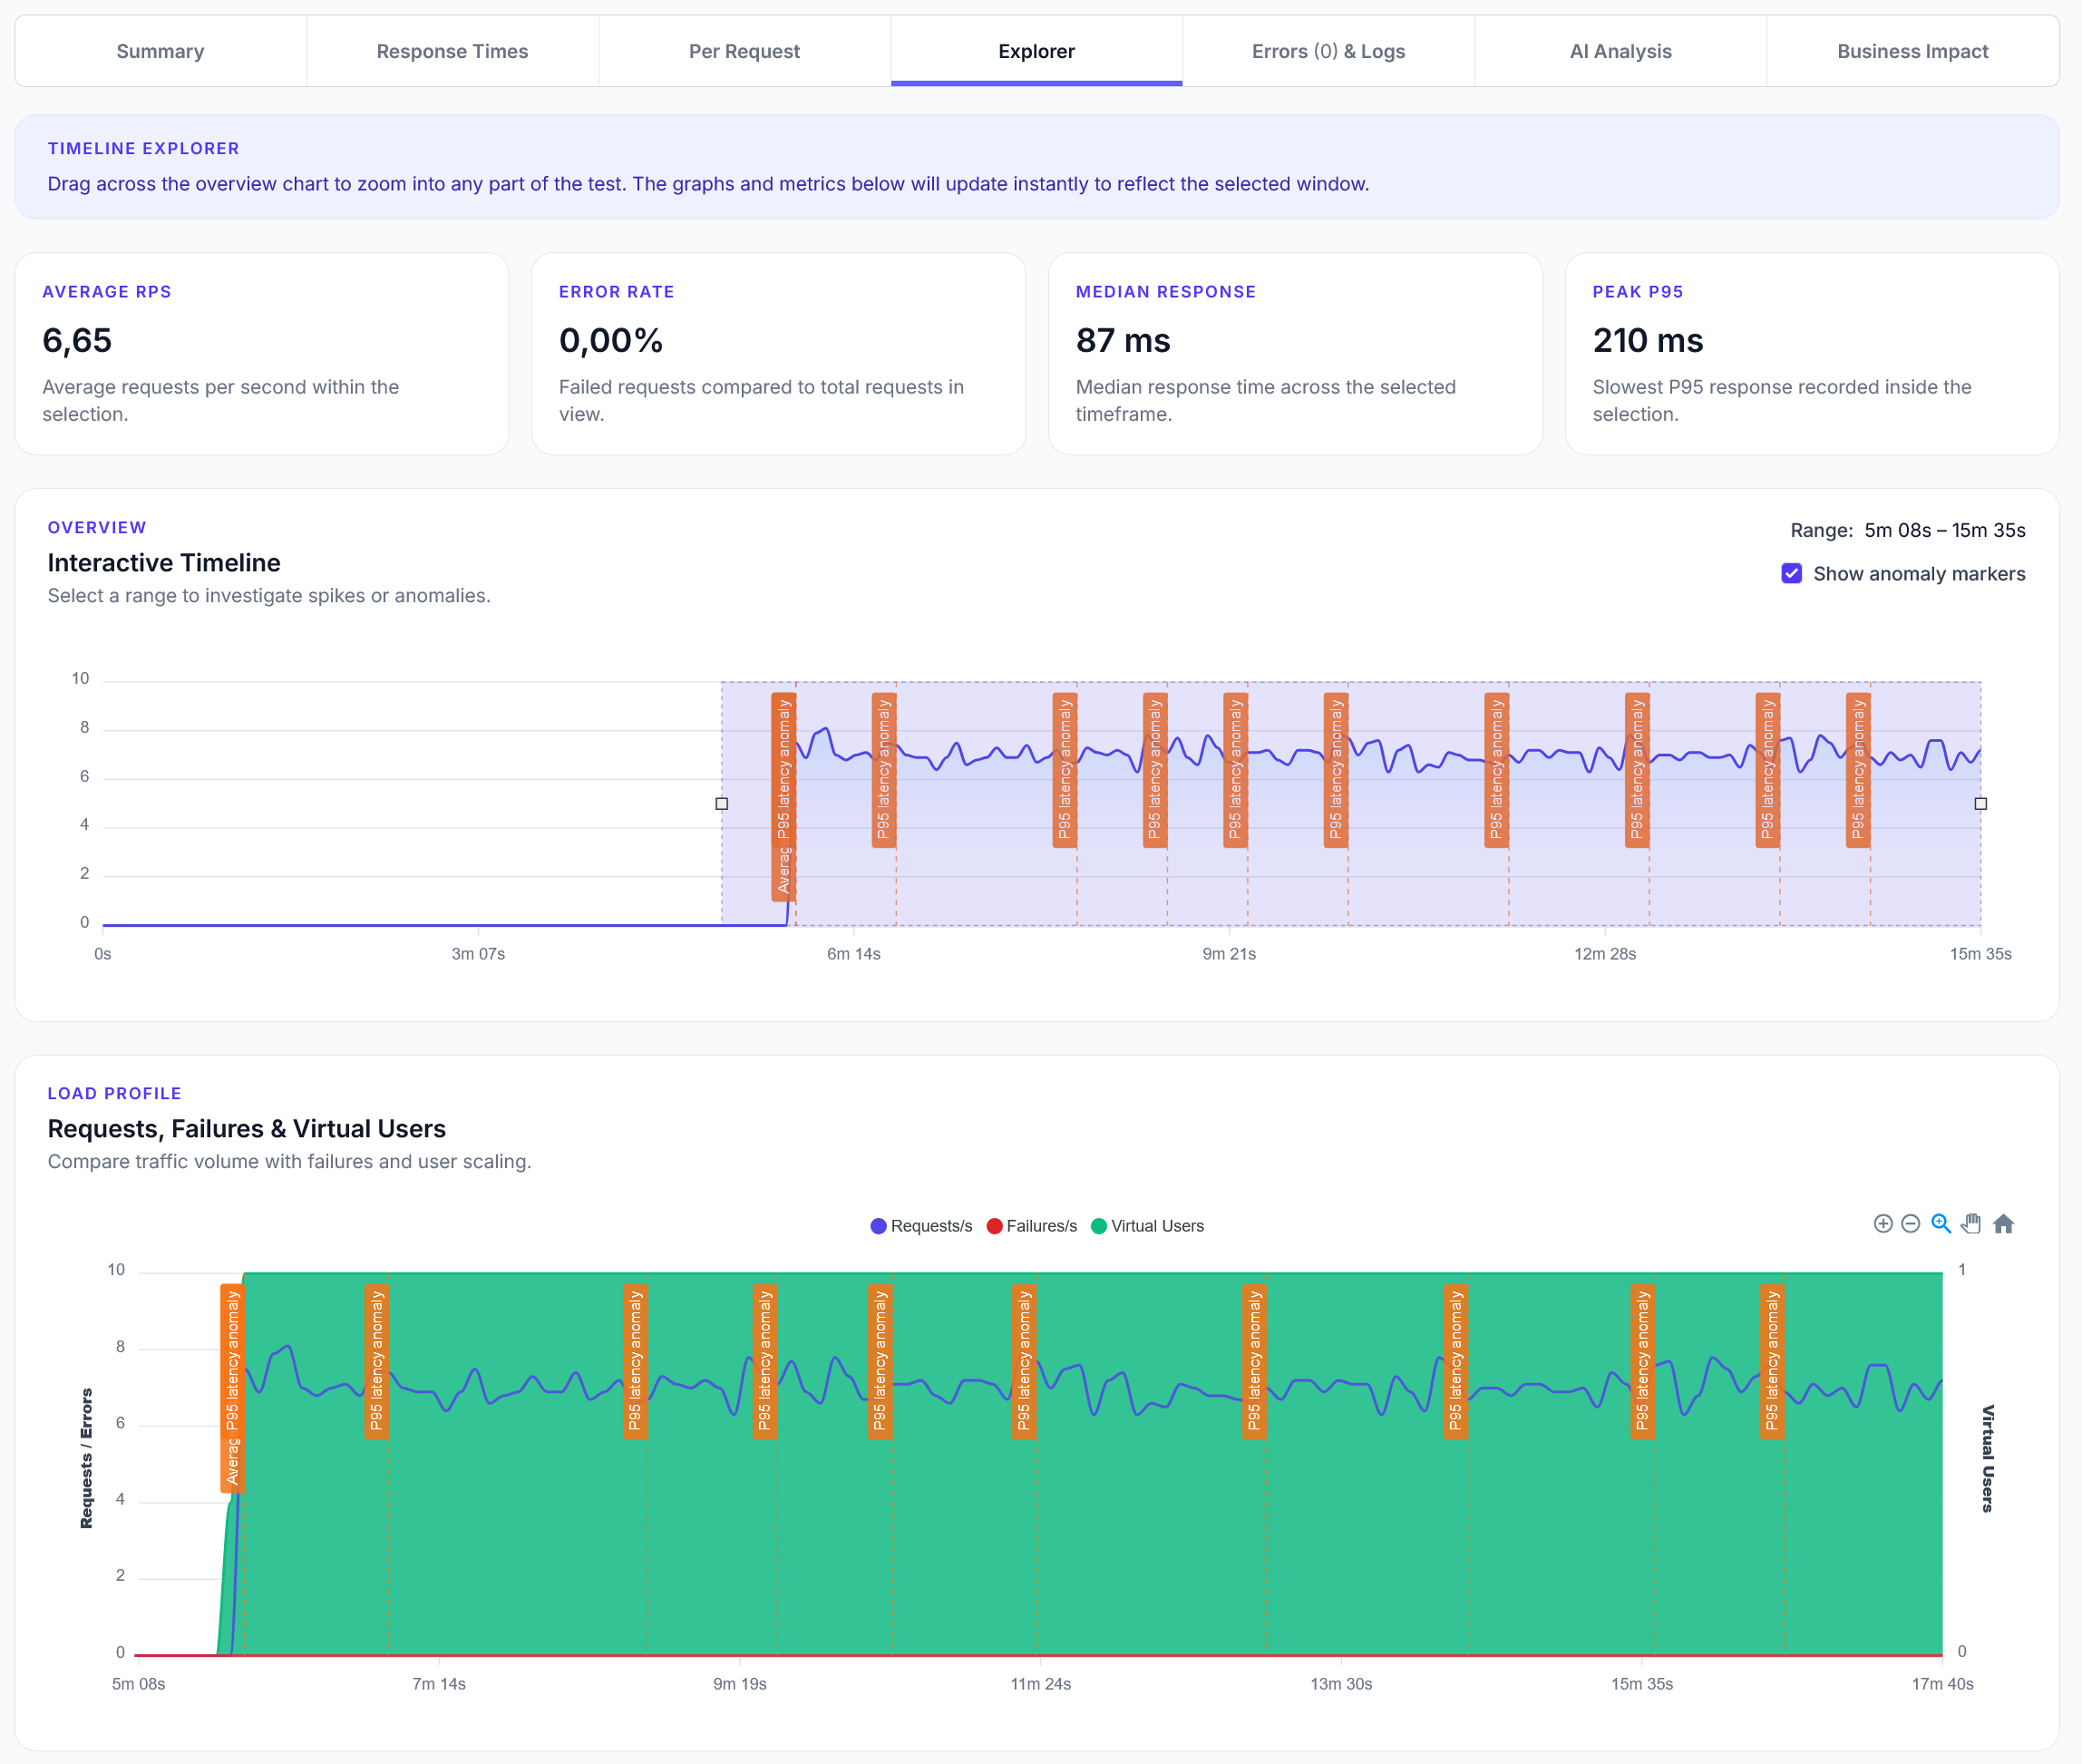
We have added a new Explorer feature to reports, with a timeline scrubber and easy anomaly detection.
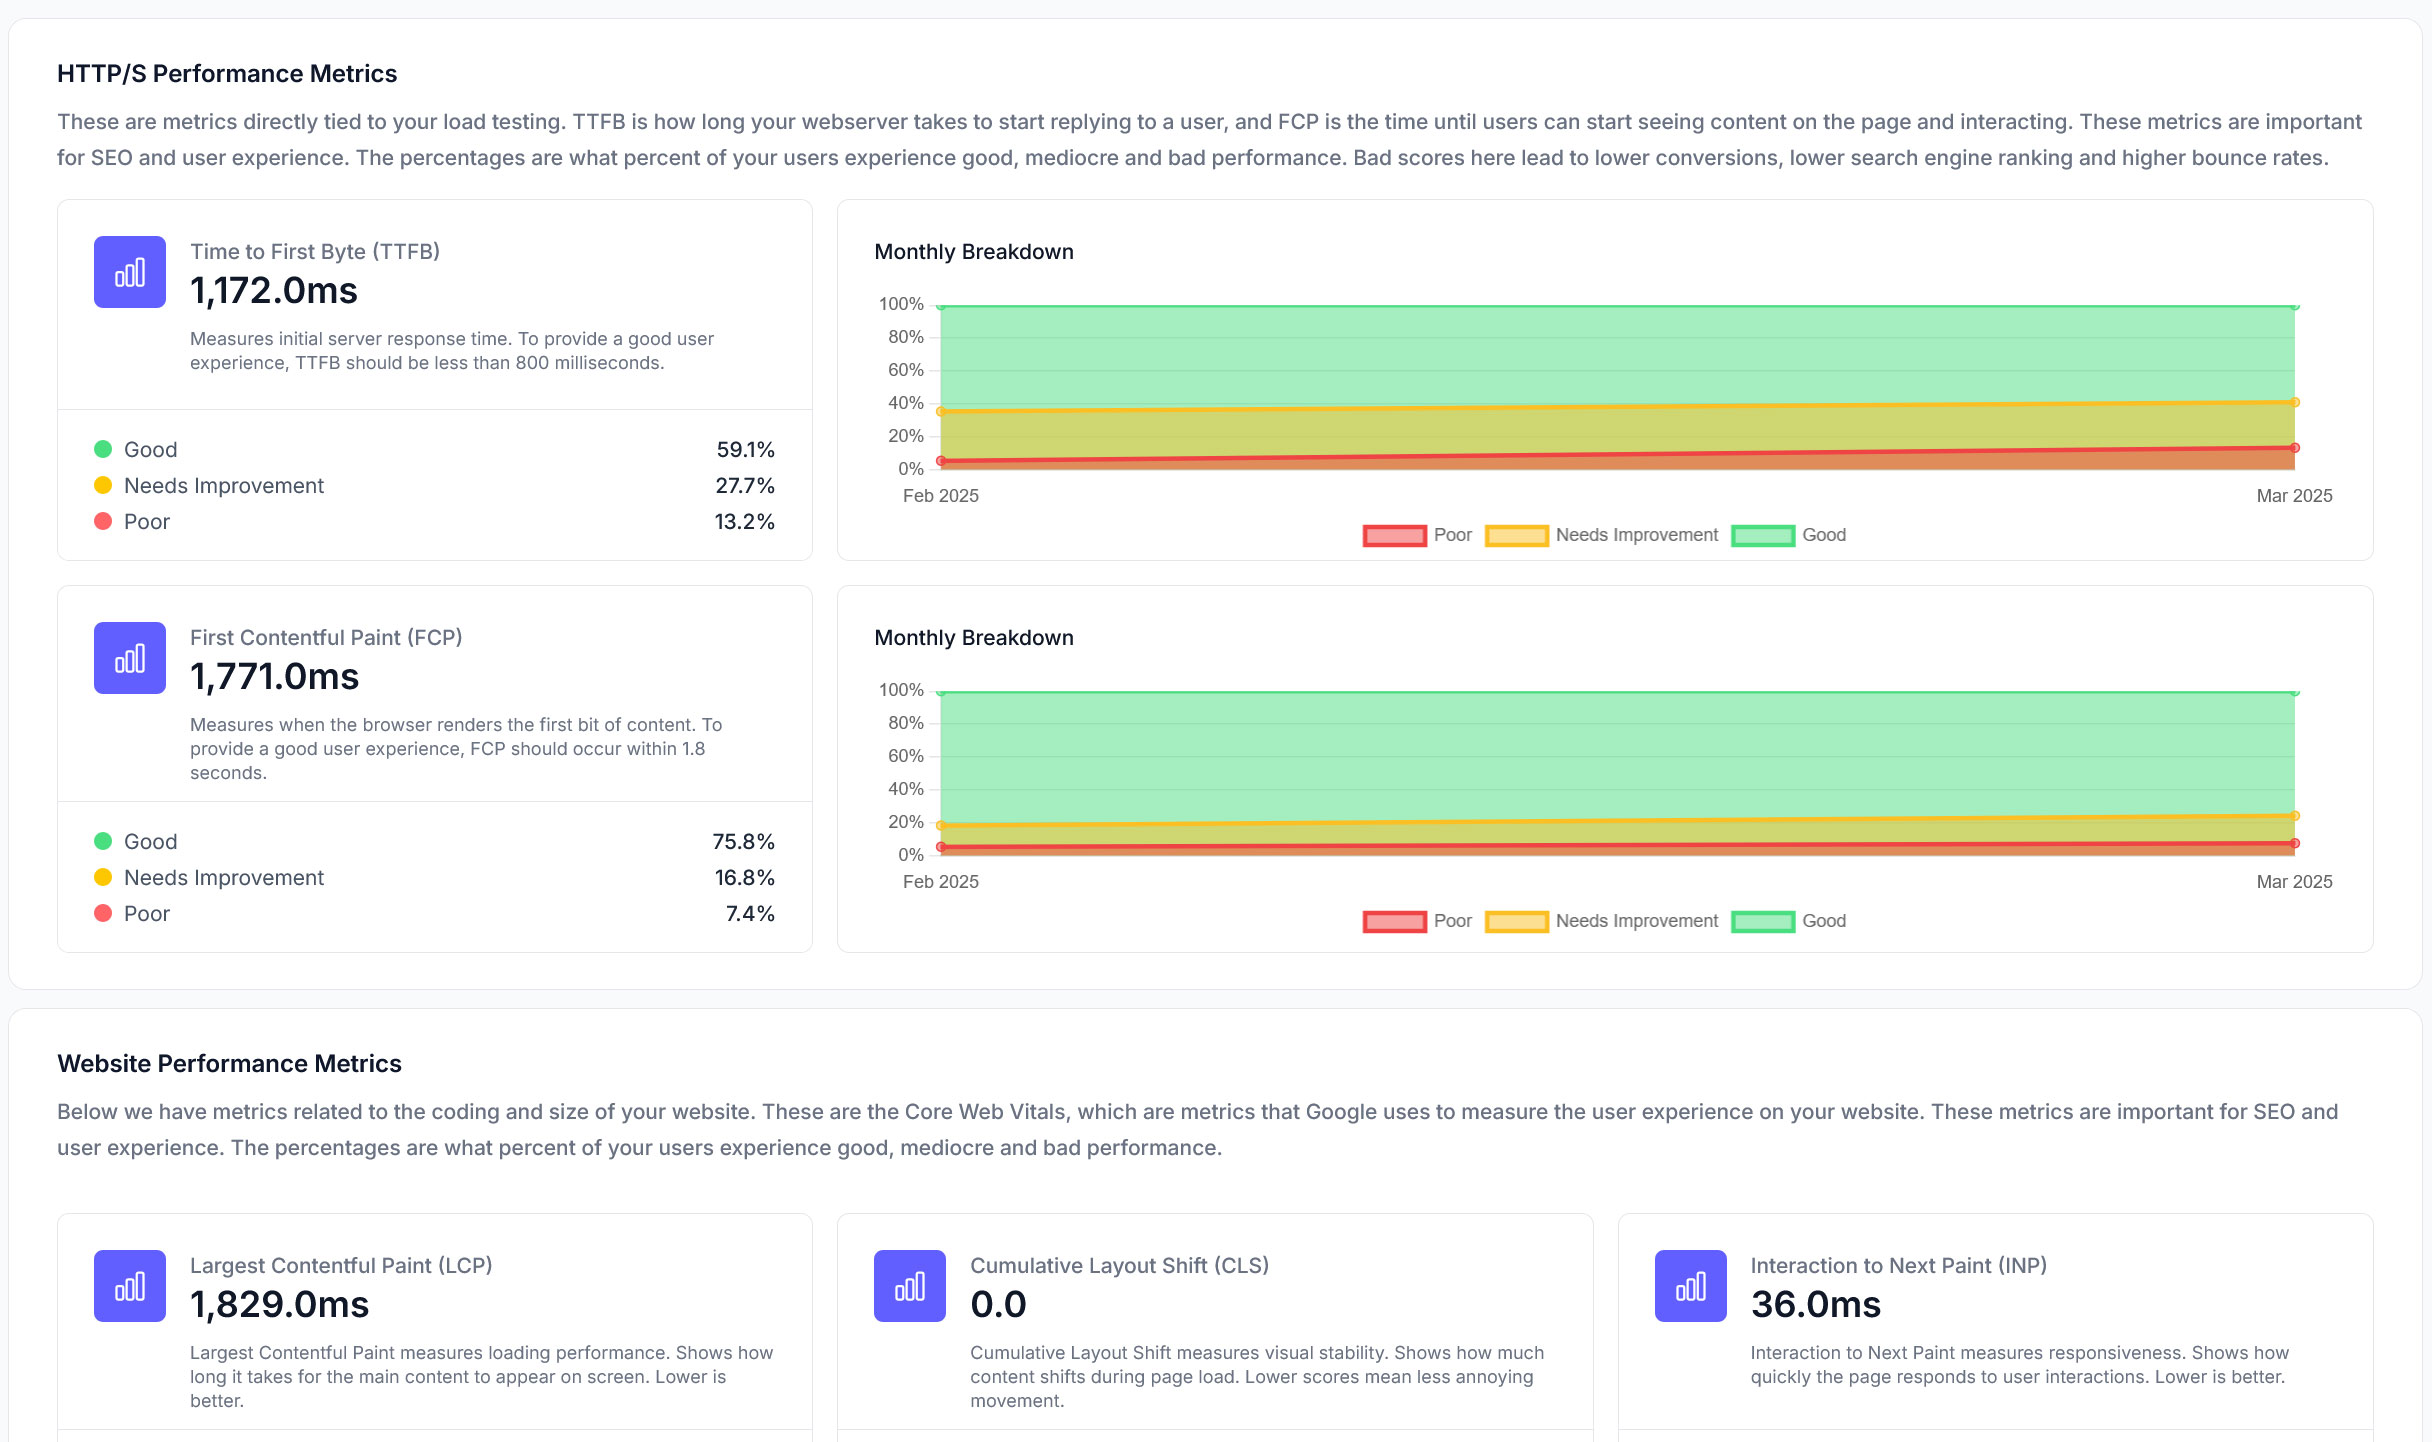
Monitor Core Web Vitals, Lighthouse scores, and response times to improve SEO rankings, increase conversions, and ensure your critical applications work optimally 24/7.
Real User Experience Data
Monitor actual user experience with Chrome User Experience Report data. Track performance metrics that directly impact SEO rankings and user satisfaction.
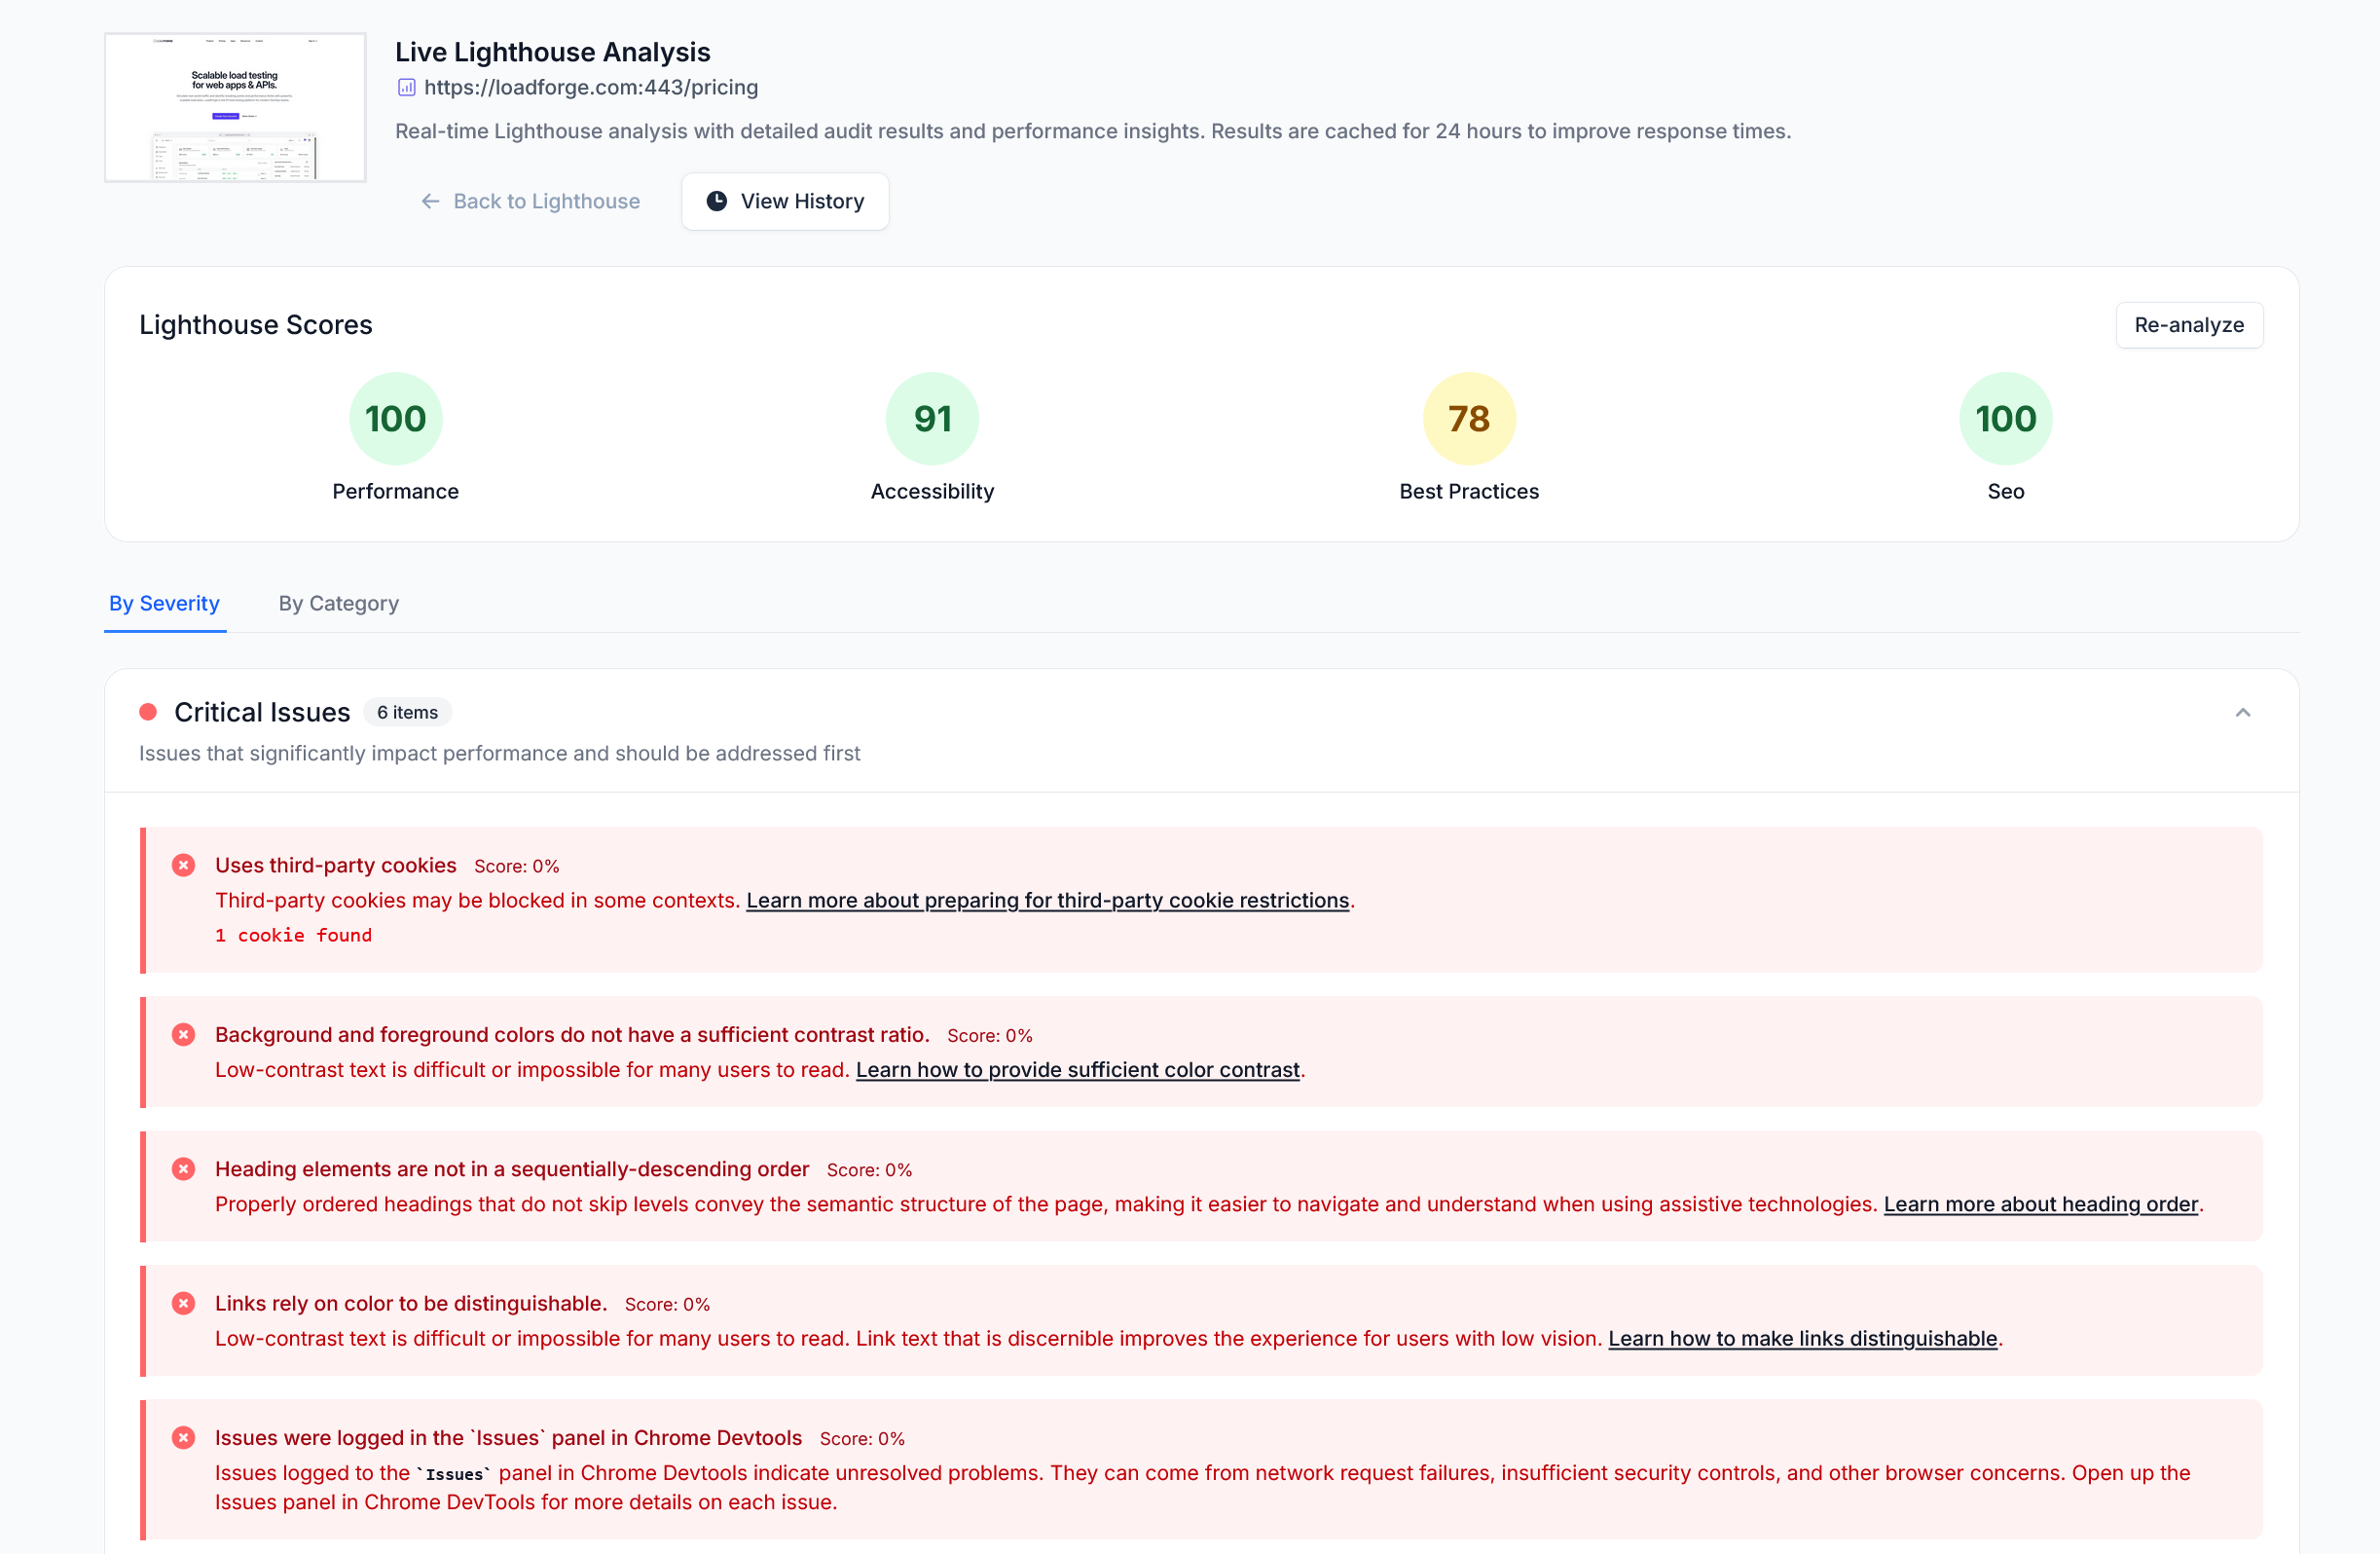
Technical Analysis & Insights
Comprehensive technical analysis with Google Lighthouse. Get actionable insights across four key dimensions that affect user experience and business outcomes.
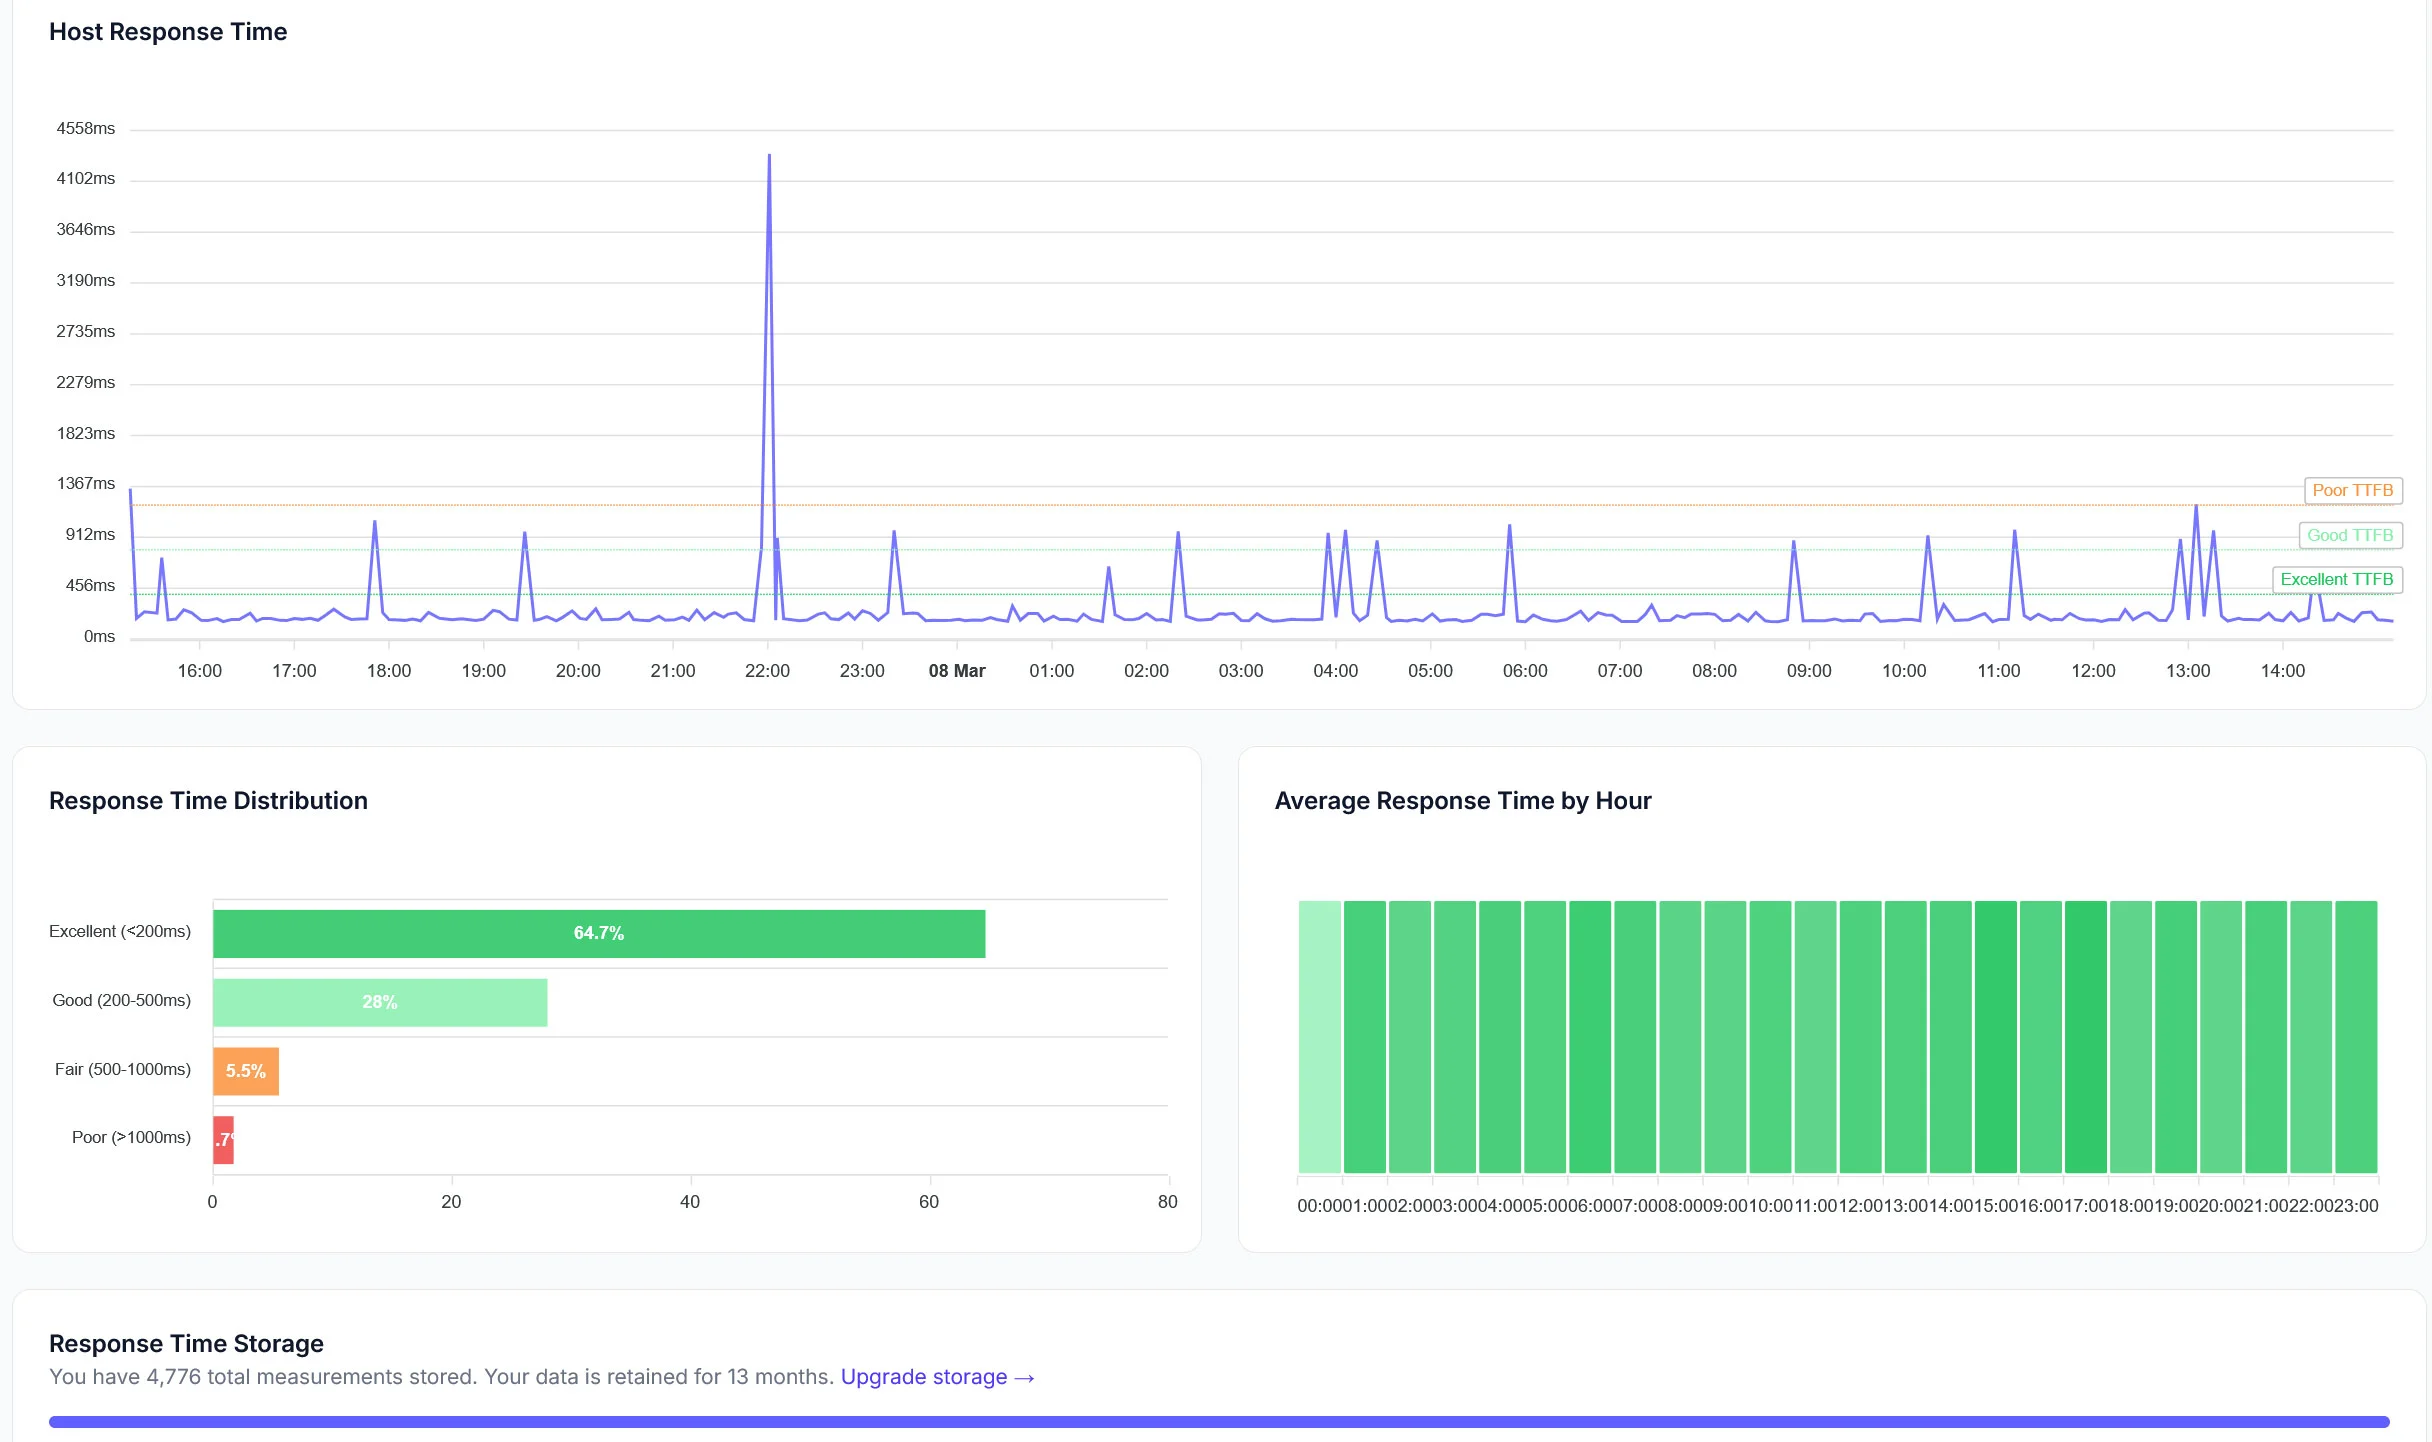
24/7 Server Monitoring
Monitor server-side performance and availability. Track response times, uptime, and get instant alerts when issues arise.
The LoadForge Score
A comprehensive A-F grading system that combines all performance metrics into one easy-to-understand score.
Monitor what matters most
LoadForge keeps your highest-value properties fast, reliable, and always available.
Guarantee lightning-fast load times and top Core Web Vitals for your public-facing pages.
Monitor checkout flows, product pages and APIs so slowdowns never cost you sales.
Ensure your backend and third-party integrations respond quickly and reliably.
Start tracking Core Web Vitals, Lighthouse scores, and response times in minutes.