Introduction
At LoadForge, we believe every millisecond counts. That's why we're thrilled to unveil our brand-new Performance section—your one-stop dashboard for tracking, analyzing, and optimizing web performance metrics across your entire site.
What’s New in the Performance Section
- Unified Metrics View Track Response Time alongside Core Web Vitals pulled from Chrome UX Report (CrUX) data—all in one place.
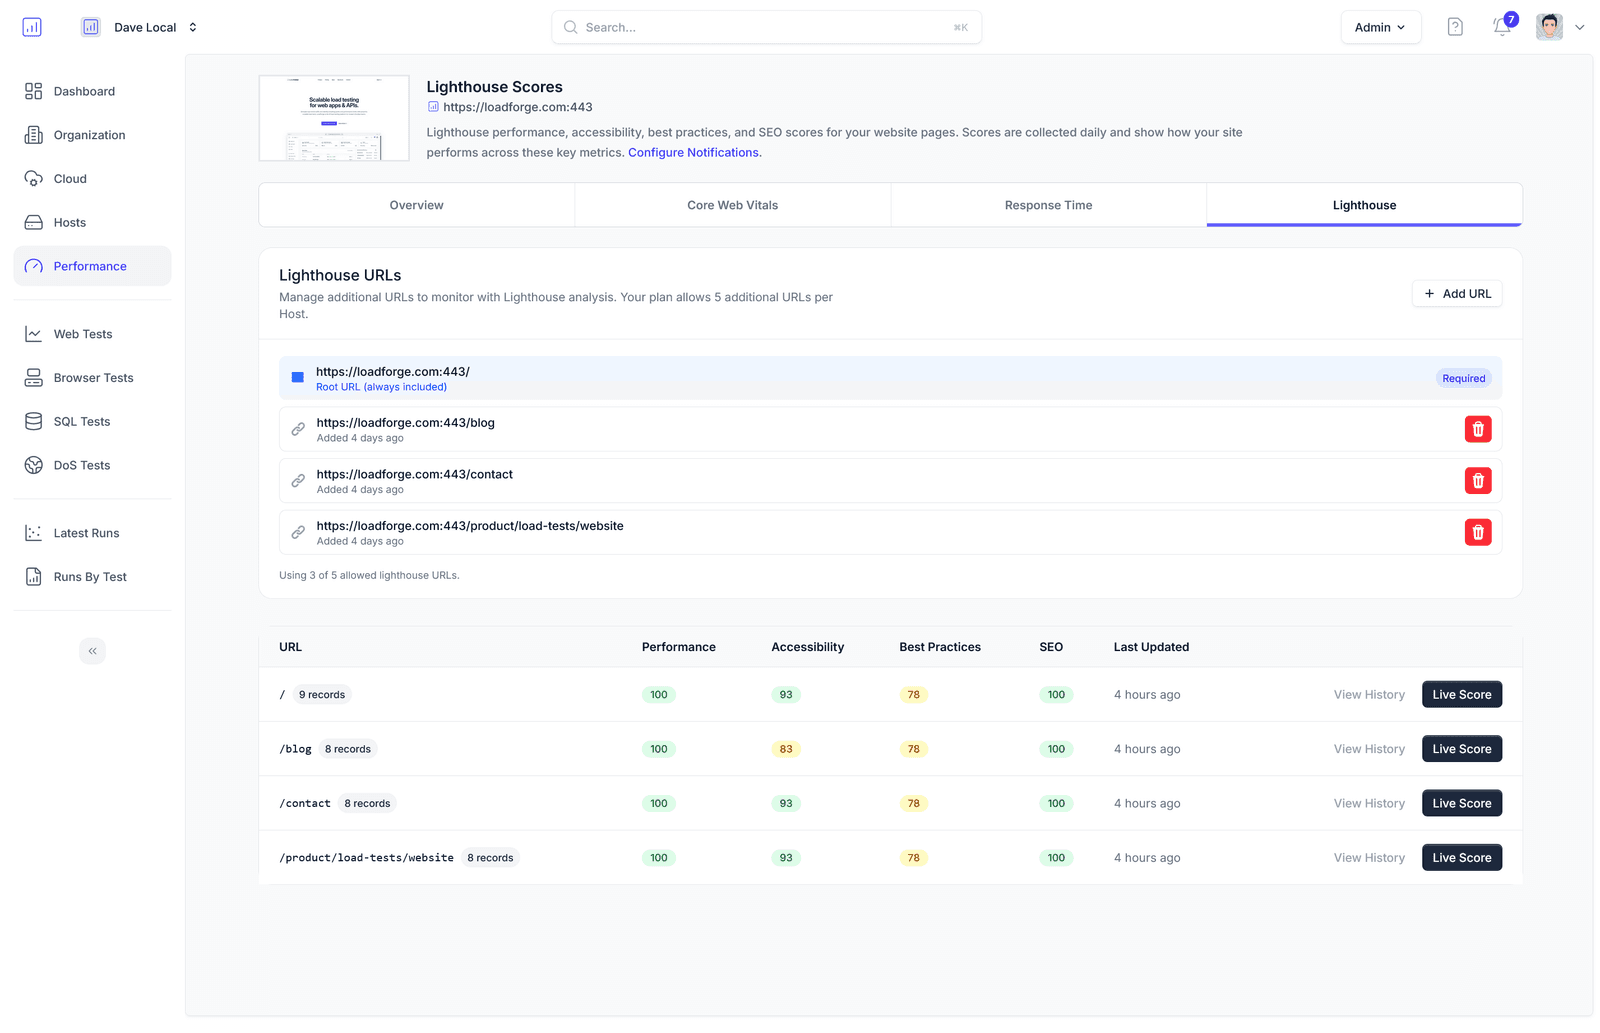
- Lighthouse-Powered Insights Automatically generate scores for Performance, Accessibility, Best Practices, and SEO on both your home page and subpages.
- Real-Time Alerts Get notified instantly whenever any metric shifts—spikes in TTFB, dips in LCP, or changes in your SEO grade.
- Overall LoadForge Score See your site’s comprehensive health at a glance with our new, easy-to-understand rating.
⭐ LoadForge Rating System
We’ve designed a simple, letter-grade system backed by weighted scoring so you can quickly gauge your site’s performance:
| Grade | Score Range | Badge Color | Description |
|---|---|---|---|
| A | 90–100% | 🟢 Green | Excellent performance across all metrics |
| B | 80–89% | 🔵 Blue | Good performance |
| C | 70–79% | 🟡 Yellow | Fair performance |
| D | 60–69% | 🟠 Orange | Poor performance |
| F | 0–59% | 🔴 Red | Very poor performance |
| N/A | — | ⚪ Gray | Insufficient data |
Weighted Scoring Breakdown
-
40% Core Web Vitals
- TTFB, FCP, LCP, CLS, INP (via CrUX)
-
30% Response Time
- Average server response time
-
30% Lighthouse Performance
- Google’s standardized Lighthouse score
Why This Matters
- Holistic Optimization Combine real-world user data (CrUX) with lab-based audits (Lighthouse) to see both actual experience and technical best practices.
- Proactive Monitoring Automated alerts mean you can address regressions before they impact your users or SEO rankings.
- Actionable Insights Drill down into individual metrics and subpage reports to pinpoint exactly where improvements are needed.
- Clear Benchmarking Our A–F grading system gives you a straightforward way to measure progress and share results with stakeholders.
Get Started Today
Head over to the Performance section in your LoadForge dashboard and explore:
- Site Overview: Your overall LoadForge Score and grade.
- Metric Deep Dive: Detailed charts for Core Web Vitals, response time trends, and Lighthouse reports.
- Alert Configuration: Customize thresholds and notification preferences.
Elevate your web performance monitoring in seconds—because faster sites drive happier users, better engagement, and higher conversions.
Learn more on our documentation site.
Related: Combine performance monitoring with continuous load testing to catch regressions before they impact users, or use reporting & analytics to track trends across all your test runs.