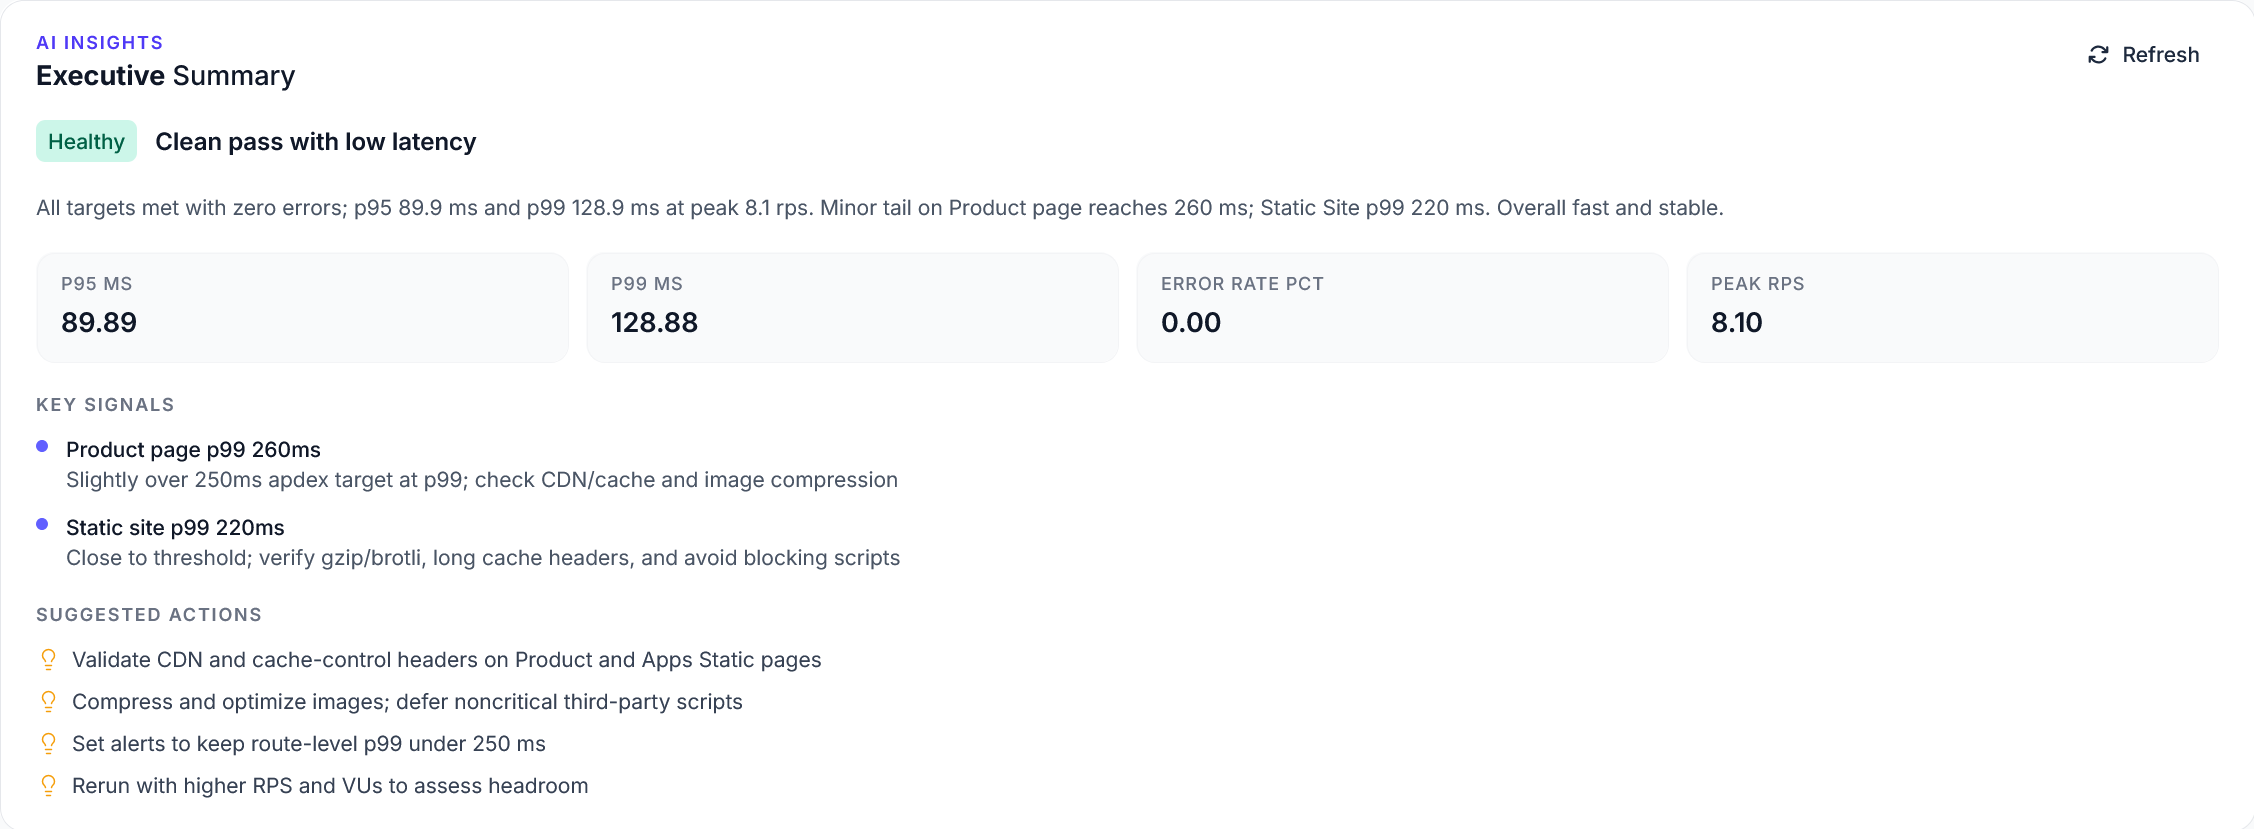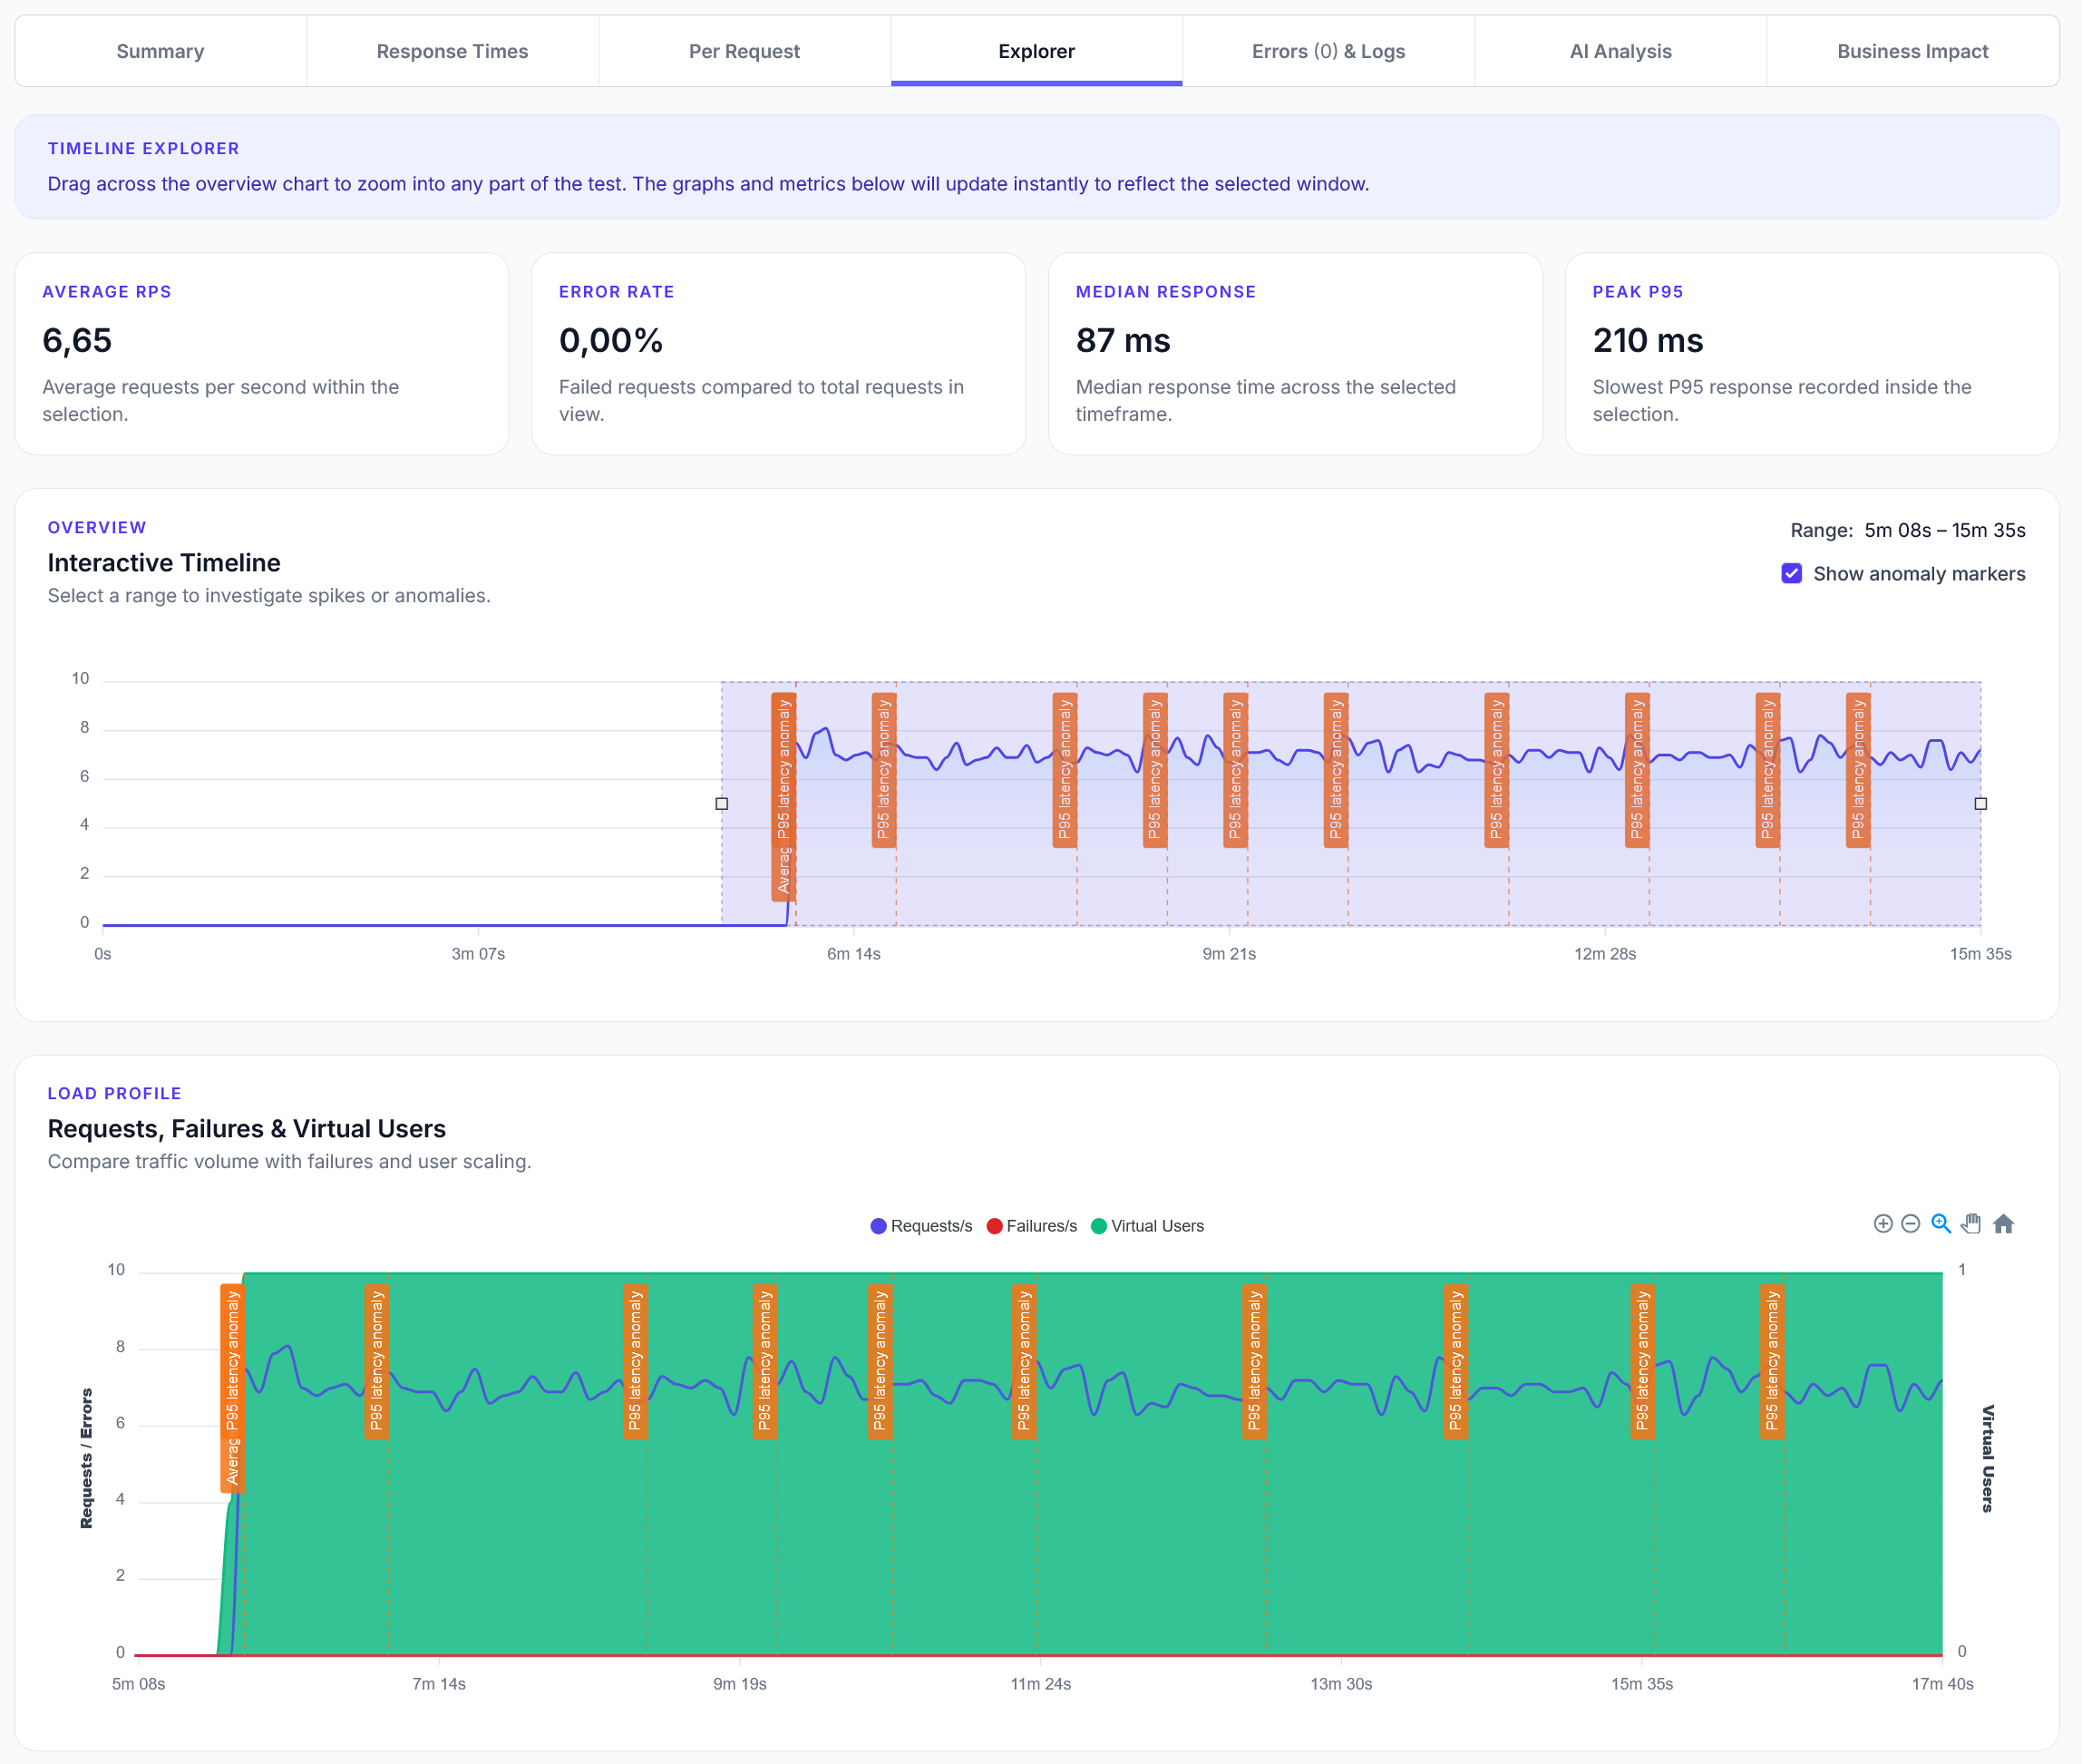
Explorer reports addition
We have added a new Explorer feature to reports, with a timeline scrubber and easy anomaly detection.
Basic performance regression testing to compare current performance against baselines and detect performance degradation
LoadForge can record your browser, graphically build tests, scan your site with a wizard and more. Sign up now to run your first test.
This guide shows how to detect performance regressions by comparing current performance against established baselines. Perfect for monitoring performance over time and catching degradation.
from locust import task, HttpUser
import time
import statistics

class PerformanceRegressionUser(HttpUser):
    def on_start(self):
        # Performance baselines (in milliseconds)
        # These would typically be loaded from a file or database
        self.baselines = {
            "/api/users": {"avg": 150, "p95": 300, "p99": 500},
            "/api/products": {"avg": 200, "p95": 400, "p99": 600},
            "/api/orders": {"avg": 250, "p95": 500, "p99": 800},
            "/api/search": {"avg": 300, "p95": 600, "p99": 1000},
            "/": {"avg": 100, "p95": 200, "p99": 350}
        }

        # Regression thresholds (percentage increase that triggers alert)
        self.regression_thresholds = {
            "avg": 20,  # 20% increase in average response time
            "p95": 25,  # 25% increase in 95th percentile
            "p99": 30   # 30% increase in 99th percentile
        }

        # Store current test results
        self.current_results = {}
        for endpoint in self.baselines.keys():
            self.current_results[endpoint] = []

    @task(4)
    def test_api_performance(self):
        """Test API endpoints and collect performance data"""
        endpoint = "/api/users"

        start_time = time.time()

        with self.client.get(endpoint, name="API Performance Test") as response:
            response_time = (time.time() - start_time) * 1000  # Convert to milliseconds

            if response.status_code == 200:
                # Store response time for analysis
                self.current_results[endpoint].append(response_time)

                # Check against baseline immediately
                baseline = self.baselines[endpoint]
                if response_time > baseline["p99"]:
                    print(f"ALERT: {endpoint} response time {response_time:.0f}ms exceeds P99 baseline {baseline['p99']}ms")
                elif response_time > baseline["p95"]:
                    print(f"WARNING: {endpoint} response time {response_time:.0f}ms exceeds P95 baseline {baseline['p95']}ms")
                else:
                    print(f"{endpoint}: {response_time:.0f}ms (within baseline)")
            else:
                response.failure(f"API request failed: {response.status_code}")

    @task(3)
    def test_product_performance(self):
        """Test product API performance"""
        endpoint = "/api/products"

        start_time = time.time()

        with self.client.get(endpoint, name="Product Performance Test") as response:
            response_time = (time.time() - start_time) * 1000

            if response.status_code == 200:
                self.current_results[endpoint].append(response_time)

                baseline = self.baselines[endpoint]
                if response_time > baseline["avg"] * 2:  # More than 2x average
                    print(f"CRITICAL: {endpoint} response time {response_time:.0f}ms is {response_time/baseline['avg']:.1f}x baseline average")
                elif response_time > baseline["p95"]:
                    print(f"SLOW: {endpoint} response time {response_time:.0f}ms exceeds P95 baseline")
                else:
                    print(f"{endpoint}: {response_time:.0f}ms (good)")
            else:
                response.failure(f"Product API failed: {response.status_code}")

    @task(2)
    def test_search_performance(self):
        """Test search API performance"""
        endpoint = "/api/search"

        # Test with different search queries
        search_queries = ["test", "product", "user", "order", "data"]
        query = {"q": search_queries[len(self.current_results[endpoint]) % len(search_queries)]}

        start_time = time.time()

        with self.client.get(endpoint, params=query, name="Search Performance Test") as response:
            response_time = (time.time() - start_time) * 1000

            if response.status_code == 200:
                self.current_results[endpoint].append(response_time)

                baseline = self.baselines[endpoint]
                performance_ratio = response_time / baseline["avg"]

                if performance_ratio > 2.0:
                    print(f"REGRESSION: Search {response_time:.0f}ms is {performance_ratio:.1f}x slower than baseline")
                elif performance_ratio > 1.5:
                    print(f"DEGRADED: Search {response_time:.0f}ms is {performance_ratio:.1f}x slower than baseline")
                else:
                    print(f"Search: {response_time:.0f}ms ({performance_ratio:.1f}x baseline)")
            else:
                response.failure(f"Search API failed: {response.status_code}")

    @task(2)
    def test_homepage_performance(self):
        """Test homepage performance"""
        endpoint = "/"

        start_time = time.time()

        with self.client.get(endpoint, name="Homepage Performance Test") as response:
            response_time = (time.time() - start_time) * 1000

            if response.status_code == 200:
                self.current_results[endpoint].append(response_time)

                baseline = self.baselines[endpoint]
                if response_time > baseline["p95"]:
                    print(f"SLOW HOMEPAGE: {response_time:.0f}ms > P95 baseline {baseline['p95']}ms")
                else:
                    print(f"Homepage: {response_time:.0f}ms (good)")
            else:
                response.failure(f"Homepage failed: {response.status_code}")

    @task(1)
    def analyze_performance_regression(self):
        """Analyze collected data for performance regressions"""
        print("\n=== Performance Regression Analysis ===")

        for endpoint, response_times in self.current_results.items():
            if len(response_times) < 5:  # Need at least 5 samples
                continue

            # Calculate current performance metrics
            current_avg = statistics.mean(response_times)
            current_p95 = self.percentile(response_times, 95)
            current_p99 = self.percentile(response_times, 99)

            baseline = self.baselines[endpoint]

            # Check for regressions
            regressions = []

            # Average response time regression
            avg_increase = ((current_avg - baseline["avg"]) / baseline["avg"]) * 100
            if avg_increase > self.regression_thresholds["avg"]:
                regressions.append(f"Average: +{avg_increase:.1f}% ({current_avg:.0f}ms vs {baseline['avg']}ms)")

            # P95 regression
            p95_increase = ((current_p95 - baseline["p95"]) / baseline["p95"]) * 100
            if p95_increase > self.regression_thresholds["p95"]:
                regressions.append(f"P95: +{p95_increase:.1f}% ({current_p95:.0f}ms vs {baseline['p95']}ms)")

            # P99 regression
            p99_increase = ((current_p99 - baseline["p99"]) / baseline["p99"]) * 100
            if p99_increase > self.regression_thresholds["p99"]:
                regressions.append(f"P99: +{p99_increase:.1f}% ({current_p99:.0f}ms vs {baseline['p99']}ms)")

            # Report results
            if regressions:
                print(f"🚨 REGRESSION DETECTED - {endpoint}:")
                for regression in regressions:
                    print(f"  - {regression}")
            else:
                print(f"✅ {endpoint}: No significant regression")
                print(f"   Avg: {current_avg:.0f}ms (baseline: {baseline['avg']}ms)")
                print(f"   P95: {current_p95:.0f}ms (baseline: {baseline['p95']}ms)")

        print("=" * 40)

    @task(1)
    def test_concurrent_performance(self):
        """Test performance under concurrent load"""
        endpoint = "/api/orders"

        # Simulate concurrent requests
        start_times = []
        end_times = []

        # Make 3 concurrent-ish requests
        for i in range(3):
            start_time = time.time()
            start_times.append(start_time)

            with self.client.get(endpoint, name=f"Concurrent Test {i+1}") as response:
                end_time = time.time()
                end_times.append(end_time)
                response_time = (end_time - start_time) * 1000

                if response.status_code == 200:
                    self.current_results[endpoint].append(response_time)
                    print(f"Concurrent request {i+1}: {response_time:.0f}ms")
                else:
                    response.failure(f"Concurrent request {i+1} failed: {response.status_code}")

        # Analyze concurrent performance
        if len(end_times) >= 3:
            total_time = max(end_times) - min(start_times)
            avg_response_time = sum((end_times[i] - start_times[i]) * 1000 for i in range(3)) / 3

            baseline = self.baselines[endpoint]
            if avg_response_time > baseline["avg"] * 1.5:
                print(f"CONCURRENT DEGRADATION: Avg {avg_response_time:.0f}ms > 1.5x baseline {baseline['avg']}ms")
            else:
                print(f"Concurrent performance: {avg_response_time:.0f}ms (acceptable)")

    def percentile(self, data, percentile):
        """Calculate percentile of a list of numbers"""
        if not data:
            return 0

        sorted_data = sorted(data)
        index = (percentile / 100) * (len(sorted_data) - 1)

        if index.is_integer():
            return sorted_data[int(index)]
        else:
            lower = sorted_data[int(index)]
            upper = sorted_data[int(index) + 1]
            return lower + (upper - lower) * (index - int(index))

    @task(1)
    def performance_health_check(self):
        """Overall performance health check"""
        total_requests = sum(len(times) for times in self.current_results.values())

        if total_requests < 10:
            return  # Not enough data yet

        # Calculate overall health score
        healthy_endpoints = 0
        total_endpoints = 0

        for endpoint, response_times in self.current_results.items():
            if len(response_times) < 3:
                continue

            total_endpoints += 1
            current_avg = statistics.mean(response_times)
            baseline_avg = self.baselines[endpoint]["avg"]

            if current_avg <= baseline_avg * 1.2:  # Within 20% of baseline
                healthy_endpoints += 1

        if total_endpoints > 0:
            health_percentage = (healthy_endpoints / total_endpoints) * 100

            if health_percentage >= 80:
                print(f"✅ Performance Health: {health_percentage:.0f}% ({healthy_endpoints}/{total_endpoints} endpoints healthy)")
            elif health_percentage >= 60:
                print(f"⚠️ Performance Health: {health_percentage:.0f}% ({healthy_endpoints}/{total_endpoints} endpoints healthy)")
            else:
                print(f"🚨 Performance Health: {health_percentage:.0f}% ({healthy_endpoints}/{total_endpoints} endpoints healthy)")
Configure thresholds for different metrics: