Introduction to SOC2 Compliance
In today's digital landscape, ensuring the security and integrity of your web application is paramount. SOC2 (System and Organization Controls 2) compliance plays a crucial role in safeguarding sensitive data and maintaining your application's trustworthiness. This section provides an insightful overview of SOC2 compliance, its significance for web applications, and a brief introduction to its key principles: Security, Availability, Processing Integrity, Confidentiality, and Privacy.
Understanding SOC2 Compliance
SOC2 is a set of standards designed by the American Institute of CPAs (AICPA) to manage customer data based on five "Trust Service Criteria." These criteria help organizations manage and protect sensitive information. SOC2 is particularly relevant for SaaS (Software-as-a-Service) companies and any business that processes or stores customer data in the cloud.
Importance for Web Applications
Adhering to SOC2 compliance is not only a regulatory requirement but also a business imperative. For web applications, SOC2 compliance:
- Builds Trust: Demonstrates your commitment to security and data protection, fostering trust among clients and stakeholders.
- Mitigates Risks: Helps identify and address potential security vulnerabilities before they can be exploited.
- Enhances Reputation: A SOC2 certification can enhance your reputation and potentially open doors to new business opportunities.
- Ensures Legal Compliance: Helps ensure you meet legal and industry regulations, avoiding potential fines and legal issues.
Key Principles of SOC2
SOC2 compliance is built around five core principles, each focusing on a specific aspect of your service’s reliability and security.
-
Security
Security is the foundation of SOC2 compliance. This principle ensures that your systems are protected against unauthorized access. Implementing robust security measures such as firewalls, multi-factor authentication, and intrusion detection systems are imperative.
-
Availability
The availability principle ensures that your system is operational and can meet the agreed-upon performance levels. This involves implementing disaster recovery plans, regular backups, and system monitoring to minimize downtime.
-
Processing Integrity
This principle ensures that your system processing is thorough and accurate. Data processing should be complete, valid, accurate, timely, and authorized. Implementing checks and validation mechanisms in your data workflows is crucial.
-
Confidentiality
Confidentiality focuses on protecting sensitive information from unauthorized disclosure. This includes data encryption, access controls, and ensuring that only authorized individuals can access confidential data.
-
Privacy
Privacy ensures that personal information is collected, used, retained, disclosed, and disposed of in accordance with organizational privacy policies and regulations such as GDPR. This involves implementing detailed privacy policies and maintaining transparent data practices.
Conclusion
Understanding SOC2 and its core principles forms the bedrock of building a secure, reliable, and compliant web application. In the following sections, we will delve deeper into practical steps and best practices for implementing robust monitoring and logging mechanisms, ensuring your Django application meets SOC2 standards effectively.
Why Monitoring and Logging are Essential for SOC2
Achieving SOC2 compliance is a critical milestone for any Django-based web application, ensuring that your service is secure, available, and functioning with integrity. Two fundamental components in this journey are monitoring and logging. These practices not only help meet SOC2 requirements but also fortify the application's overall security posture.
The Role of Monitoring and Logging in SOC2 Compliance
SOC2 compliance revolves around five key principles: Security, Availability, Processing Integrity, Confidentiality, and Privacy. Robust monitoring and logging practices are pivotal across all these principles as they provide the necessary visibility into the system's operations and the means to respond effectively to any incidents.
Detecting Security Incidents
Monitoring and logging are the first lines of defense in identifying and responding to potential security threats. Logs capture detailed records of every action performed within the application, serving as a trail of breadcrumbs to trace back any malicious activity. For example, tracking failed login attempts, unauthorized access to sensitive information, or unexpected error patterns can be critical forensic evidence in the event of a breach.
Responding to and Mitigating Incidents
Once an anomaly is detected, timely response is crucial. With robust logging, administrators can quickly pinpoint the source and scope of the issue, facilitating swift remediation measures. This minimizes downtime and mitigates potential damage.
logger.error('Unauthorized access attempt detected', extra={
    'user_id': user.id,
    'ip_address': request.META.get('REMOTE_ADDR'),
    'timestamp': datetime.utcnow(),
})
Effective logging practices, combined with continuous monitoring, enable automated responses to certain incidents, such as blocking a suspicious IP address after multiple failed login attempts.
Maintaining System Availability
Availability is another cornerstone of SOC2. By continuously monitoring the system's health and performance, potential issues can be identified and resolved before they escalate into significant downtimes. Metrics such as CPU usage, memory consumption, and request response times are pivotal in ensuring the application remains available and responsive.
Ensuring Data Integrity
Processing integrity involves ensuring that the system performs as intended without errors or manipulation. Logs play a crucial role here by validating the correct execution of processes and workflows. Any discrepancies in the logs can highlight issues such as data corruption or unauthorized data modifications.
Best Practices for Monitoring and Logging
To leverage monitoring and logging effectively for SOC2 compliance, certain best practices should be observed:
- Comprehensive Logging: Ensure that all significant events are logged. This includes user logins, data access, modifications, and system errors.
- Log Retention Policies: Maintain an appropriate retention period for log data as per compliance requirements. Ensure old logs are archived and secured.
- Real-Time Monitoring: Utilize tools for real-time monitoring to detect and respond to incidents promptly. Integrate dashboards and alerting mechanisms for critical events.
- Secure Logging: Protect the integrity and confidentiality of log data by using encryption and secure transport mechanisms.
- Regular Audit and Review: Periodically audit logs to ensure compliance and identify any blind spots or gaps in the current logging setup.
Conclusion
In conclusion, monitoring and logging are indispensable tools in achieving SOC2 compliance for Django applications. They provide critical insights into the application's operations, help detect and mitigate security incidents, and ensure the system's reliability and integrity. By implementing robust monitoring and logging practices, organizations can not only meet regulatory requirements but also enhance their overall security posture and operational resilience.
Setting Up Python and Django Environment
In order to achieve SOC2 compliance with robust monitoring and logging capabilities in your Django application, we first need to set up a Python virtual environment and install Django along with essential dependencies. This step-by-step guide will walk you through the entire process, ensuring you have a solid foundation for implementing advanced logging and monitoring practices.
Step 1: Install Python and Virtualenv
Before we begin, ensure you have Python installed on your system. We recommend using Python 3.8 or later. To check if Python is installed, open your terminal and run:
python --version
To install or upgrade Python, you can download it from the official Python website.
Next, install virtualenv to create isolated Python environments:
pip install virtualenv
Step 2: Create a Virtual Environment
Navigate to your project's directory and create a new virtual environment:
mkdir myproject
cd myproject
virtualenv venv
Activate the virtual environment:
-
On Windows:
venv\Scripts\activate
-
On MacOS and Linux:
source venv/bin/activate
You should see (venv) at the beginning of your terminal prompt, indicating that the virtual environment is active.
Step 3: Install Django
With the virtual environment active, install Django using pip:
pip install django
Verify the installation by checking the Django version:
python -m django --version
Step 4: Create a New Django Project
Create a new Django project by running the following command:
django-admin startproject myproject .
This command sets up a basic Django project structure. You can now navigate to the project directory where manage.py is located.
Step 5: Install Essential Dependencies
To ensure we have the necessary tools for logging and monitoring, install the following dependencies:
pip install django-log-request-id
pip install django-prometheus
Step 6: Configure Essential Settings
Update your Django project settings to include the installed applications. Open myproject/settings.py and add the following lines to the INSTALLED_APPS list:
# myproject/settings.py
INSTALLED_APPS = [
    ...
    'django_log_request_id',
    'django_prometheus',
]
Next, add middleware for better request tracing. Update the MIDDLEWARE list in settings.py:
# myproject/settings.py
MIDDLEWARE = [
    ...
    'django_log_request_id.middleware.RequestIDMiddleware',
]
Set up Prometheus to monitor your application. Update the urls.py file to include Prometheus URLs:
# myproject/urls.py
from django.urls import path, include

urlpatterns = [
    ...
    path('', include('django_prometheus.urls')),
]
Step 7: Verify Your Setup
Run the Django development server to ensure everything is set up correctly:
python manage.py runserver
Visit http://127.0.0.1:8000 in your web browser to see the default Django welcome page. This indicates that your Django environment is set up correctly.
Conclusion
By following these steps, you have successfully set up a Django project within a Python virtual environment, installed essential dependencies, and configured the initial settings required for logging and monitoring. Your Django application is now ready for further configuration to meet SOC2 compliance standards. In the subsequent sections, we will delve into implementation details for logging frameworks, third-party integrations, real-time monitoring, and more to ensure a robust compliance posture.
Implementing Logging in Django
Implementing robust logging in Django is crucial for achieving SOC2 compliance, as well as for maintaining an excellent standard of application health and diagnostic capability. This section will guide you through configuring Django’s built-in logging framework, ensuring you can efficiently capture, store, and analyze log messages.
Setting Up Django’s Built-in Logging Framework
Django provides a flexible logging system that's customizable to fit your needs. Here, we'll configure different log levels, create log files, and format log messages. The logging settings go into the LOGGING dictionary within the Django settings.py file.
Configuring Log Levels
Log levels determine the severity of the messages that get logged. Common log levels are:
DEBUG: Detailed information, typically only of interest when diagnosing problems.INFO: Confirmation that things are working as expected.WARNING: An indication that something unexpected happened, or indicative of some problem. The software is still working as expected.ERROR: Due to a more serious problem, the software has not been able to perform some function.CRITICAL: A very serious error, indicating that the program itself may be unable to continue running.
Below is a basic configuration example to help you get started:
LOGGING = {
    'version': 1,
    'disable_existing_loggers': False,
    'formatters': {
        'verbose': {
            'format': '{levelname} {asctime} {module} {message}',
            'style': '{',
        },
        'simple': {
            'format': '{levelname} {message}',
            'style': '{',
        },
    },
    'handlers': {
        'file': {
            'level': 'DEBUG',
            'class': 'logging.FileHandler',
            'filename': '/path/to/your/logfile.log',
            'formatter': 'verbose',
        },
        'console': {
            'level': 'DEBUG',
            'class': 'logging.StreamHandler',
            'formatter': 'simple',
        },
    },
    'loggers': {
        'django': {
            'handlers': ['file', 'console'],
            'level': 'DEBUG',
            'propagate': True,
        },
    },
}
Creating Log Files
To store logs, you may use file handlers in Django’s logging configuration. You specify the log file path where logs will be written. Ensure that the directory for log files has the appropriate write permissions.
'handlers': {
    'file': {
        'level': 'DEBUG',
        'class': 'logging.FileHandler',
        'filename': '/var/log/django/myapp.log',
        'formatter': 'verbose',
    },
    'console': {
        'level': 'DEBUG',
        'class': 'logging.StreamHandler',
        'formatter': 'simple',
    },
},
Formatting Log Messages
The format of log messages can be customized to include relevant details like timestamp, log level, message, etc., using formatters.
- Verbose Format: Provides a detailed log message, which can be very useful while debugging.
- Simple Format: Offers a more straightforward log message, often used for console output.
Example formatter configuration:
'formatters': {
    'verbose': {
        'format': '{levelname} {asctime} {module} {message}',
        'style': '{',
    },
    'simple': {
        'format': '{levelname} {message}',
        'style': '{',
    },
},
Putting It All Together
When you combine these configurations, you can set up a comprehensive logging system within Django that will help you in maintaining SOC2 compliance through effective monitoring and reporting of your application’s operations.
Your final LOGGING configuration in settings.py might look like this:
LOGGING = {
    'version': 1,
    'disable_existing_loggers': False,
    'formatters': {
        'verbose': {
            'format': '{levelname} {asctime} {module} {message}',
            'style': '{',
        },
        'simple': {
            'format': '{levelname} {message}',
            'style': '{',
        },
    },
    'handlers': {
        'file': {
            'level': 'DEBUG',
            'class': 'logging.FileHandler',
            'filename': '/var/log/django/myapp.log',
            'formatter': 'verbose',
        },
        'console': {
            'level': 'DEBUG',
            'class': 'logging.StreamHandler',
            'formatter': 'simple',
        },
    },
    'loggers': {
        'django': {
            'handlers': ['file', 'console'],
            'level': 'DEBUG',
            'propagate': True,
        },
    },
}
In this configuration:
- Logs will be written to
/var/log/django/myapp.log.
- Both file and console handlers are set to log at the
DEBUG level.
- Different formatters are used to make log entries either verbose or simple.
By setting up Django’s logging framework as shown, you can ensure that critical application events are logged and available for review, supporting your efforts towards SOC2 compliance.
Integrating Third-Party Logging Services
Enhancing your Django application's logging capabilities with third-party logging services can greatly improve log management, searchability, and analysis. This section will guide you through the process of integrating Django with popular logging services like Splunk, Loggly, and the ELK stack (Elasticsearch, Logstash, and Kibana).
Step 1: Choosing a Logging Service
Before integrating, it's essential to choose the right logging service for your needs. Here's a brief comparison:
| Logging Service |
Features |
Suitable For |
| Splunk |
Advanced search, real-time monitoring, powerful dashboards |
Large enterprises with complex needs |
| Loggly |
Easy setup, cloud-based, real-time analytics |
SMBs looking for a straightforward solution |
| ELK Stack |
Highly customizable, open-source, scalable |
Organizations with in-house expertise on infrastructure management |
Step 2: Setting Up Django Logging
First, ensure that your Django logging configuration is set to a quality standard. Use the LOGGING setting in your settings.py file:
LOGGING = {
    'version': 1,
    'disable_existing_loggers': False,
    'handlers': {
        'console': {
            'class': 'logging.StreamHandler',
        },
        'file': {
            'class': 'logging.FileHandler',
            'filename': 'django.log',
        },
        'external': {  # placeholder for third-party integration
            'class': 'logging.NullHandler',  # dummy handler
        },
    },
    'loggers': {
        'django': {
            'handlers': ['console', 'file', 'external'],
            'level': 'INFO',
        },
    },
}
Step 3: Integrating Splunk
-
Install Splunk's HTTP Event Collector (HEC):
pip install splunk-logging
-
Modify Your Django LOGGING Configuration:
import splunk_handler

SPLUNK_HOST = "splunk-server"
SPLUNK_PORT = "8088"
SPLUNK_TOKEN = "your-token"

LOGGING['handlers']['splunk'] = {
    'level': 'INFO',
    'class': 'splunk_handler.SplunkHandler',
    'host': SPLUNK_HOST,
    'port': SPLUNK_PORT,
    'token': SPLUNK_TOKEN,
    'index': 'main',
}

LOGGING['loggers']['django']['handlers'].append('splunk')
Step 4: Integrating Loggly
-
Install Loggly's Python Handler:
pip install loggly-python-handler
-
Modify Your Django LOGGING Configuration:
from loggly.handlers import HTTPSHandler
import logging

LOGGLY_TOKEN = "your-loggly-token"

LOGGING['handlers']['loggly'] = {
    'level': 'INFO',
    'class': 'loggly.handlers.HTTPSHandler',
    'url': f'https://logs-01.loggly.com/inputs/{LOGGLY_TOKEN}/tag/python',
}

LOGGING['loggers']['django']['handlers'].append('loggly')
Step 5: Integrating ELK Stack
-
Install Logstash and Logstash-Formatter:
pip install python-logstash logstash-formatter
-
Modify Your Django LOGGING Configuration:
LOGGING['handlers']['logstash'] = {
    'level': 'INFO',
    'class': 'logstash.TCPLogstashHandler',
    'host': 'logstash-host',  # Logstash server's IP or hostname
    'port': 5000,  # Logstash server's port
    'version': 1,
    'formatter': 'logstash',
}

LOGGING['formatters']['logstash'] = {
    '()': 'logstash_formatter.LogstashFormatterV1'
}

LOGGING['loggers']['django']['handlers'].append('logstash')
Conclusion
Integrating third-party logging services with Django, such as Splunk, Loggly, or the ELK stack, can significantly enhance your application's logging capabilities. These services provide powerful tools for log management, search, and analysis, helping you to maintain SOC2 compliance by ensuring robust and efficient handling of log data.
By following the outlined steps for each service, you can leverage their unique features to bolster your Django application's logging system, making it easier to monitor, analyze, and respond to events in real-time.
Real-time Monitoring with Django
Real-time monitoring is a crucial part of maintaining SOC2 compliance for your Django application. It allows you to proactively detect issues, analyze performance bottlenecks, and ensure that your application is running smoothly. Two powerful tools for achieving this are Prometheus and Grafana, which can be combined to provide a comprehensive monitoring solution. This section will guide you through setting up real-time monitoring for your Django application using these tools.
Step 1: Set Up Prometheus
Prometheus is an open-source monitoring and alerting toolkit designed for reliability and simplicity. Follow these steps to set up Prometheus:
-
Install Prometheus:
Download the latest Prometheus release from the official Prometheus website, or use the following commands to install it on a Unix-based system:
wget https://github.com/prometheus/prometheus/releases/download/v2.29.1/prometheus-2.29.1.linux-amd64.tar.gz
tar xvfz prometheus-*.tar.gz
cd prometheus-*
-
Configure Prometheus:
Create a configuration file (prometheus.yml) for Prometheus. Here’s a basic configuration that sets up Prometheus to scrape metrics from your Django application:
global:
  scrape_interval: 15s

scrape_configs:
  - job_name: 'django-app'
    static_configs:
      - targets: ['localhost:8000']
Save this file in the same directory as the Prometheus binary.
-
Start Prometheus:
Run Prometheus with the above configuration using:
./prometheus --config.file=prometheus.yml
Step 2: Integrate Prometheus with Django
To expose metrics from your Django application to Prometheus, you'll need to use a Django middleware or library designed for this purpose. The most common choice is django-prometheus.
-
Install django-prometheus:
Add django-prometheus to your Django project:
pip install django-prometheus
-
Configure Django Settings:
Update your settings.py to include django-prometheus in your INSTALLED_APPS and set up the middleware:
INSTALLED_APPS = [
    ...
    'django_prometheus',
    ...
]

MIDDLEWARE = [
    ...
    'django_prometheus.middleware.PrometheusBeforeMiddleware',
    'django_prometheus.middleware.PrometheusAfterMiddleware',
    ...
]
-
Include Prometheus URLs:
Add Prometheus metrics endpoint to your urls.py to expose the metrics:
from django.urls import path, include

urlpatterns = [
    ...
    path('', include('django_prometheus.urls')),
]
Step 3: Set Up Grafana
Grafana is an open-source platform for monitoring and observability, capable of visualizing metrics stored in Prometheus.
-
Install Grafana:
Download and install Grafana from the official Grafana website, or use the following commands for a Linux system:
sudo apt-get install -y software-properties-common
sudo add-apt-repository "deb https://packages.grafana.com/oss/deb stable main"
sudo apt-get update
sudo apt-get install -y grafana
-
Start Grafana:
Start the Grafana service:
sudo systemctl start grafana-server
sudo systemctl enable grafana-server
-
Configure Grafana:
-
Create Dashboards:
-
Import Prebuilt Dashboards:
Grafana has a library of prebuilt dashboards. For Django applications, you might find relevant dashboards by searching for "Django" or "Prometheus".
-
Build Custom Dashboards:
Create custom dashboards by adding panels to visualize key metrics such as request latency, error rates, and throughput. Click + > Dashboard > Add Panel, select the type of visualization, and configure it by querying Prometheus metrics (e.g., http_requests_total).
Step 4: Visualizing Key Metrics
Prometheus collects a variety of metrics useful for monitoring the health and performance of your Django application. Here are some common metrics to track:
-
HTTP Request Metrics:
sum(rate(http_requests_total[1m])) by (status)
-
Response Time Metrics:
histogram_quantile(0.95, sum(rate(http_request_duration_seconds_bucket[5m])) by (le))
-
Error Rate:
sum(rate(http_requests_total{status!~"2.."}[5m])) by (status)
By setting up real-time monitoring with Prometheus and Grafana, you ensure that your Django application is continuously observed, providing crucial insights and alerting you to potential issues promptly. This integration not only aids in SOC2 compliance but also significantly enhances the reliability and performance of your web application.
Setting Up Alerts and Notifications
In any robust monitoring and logging setup, timely alerts and notifications are crucial for reacting swiftly to critical events or errors. These notifications can be sent through various channels such as email, Slack, or other messaging platforms, ensuring that your team is instantly informed and can take immediate action. This section will guide you through configuring alerts and notifications for your Django application.
Choosing Notification Channels
Before setting up alerts, you need to decide on the channels through which your team will receive notifications. Common choices include:
- Email: Basic but effective for general notifications.
- Slack: Great for team collaboration with real-time notifications.
- SMS: Ideal for urgent alerts but may incur costs.
Tools and Services for Alerts
Many third-party services can help you set up and manage alerts efficiently:
- Prometheus & Grafana: Well-known monitoring tools with strong alerting capabilities.
- Sentry: Excellent for error tracking and can send alerts based on error severity.
- PagerDuty: Designed for incident management with robust notification features.
Setting Up Alerts in Django
We'll start by configuring basic email alerts using Django’s built-in capabilities and then move on to integrating more sophisticated third-party services.
Email Alerts using Django
Django's email framework can be used to send alerts for critical issues.
-
Configure Email Backend: First, set up the email backend in settings.py.
EMAIL_BACKEND = 'django.core.mail.backends.smtp.EmailBackend'
EMAIL_HOST = 'smtp.example.com'
EMAIL_PORT = 587
EMAIL_USE_TLS = True
EMAIL_HOST_USER = 'your-email@example.com'
EMAIL_HOST_PASSWORD = 'your-email-password'
-
Sending Alerts via Email: Create a simple function to send email alerts.
from django.core.mail import send_mail

def send_alert(subject, message, recipient_list):
    send_mail(
        subject,
        message,
        'server-alerts@example.com',
        recipient_list,
        fail_silently=False,
    )
-
Triggering an Alert: Use this function within your error handling logic.
try:
    # Your code here
except Exception as e:
    send_alert(
        subject="Critical Error in Django App",
        message=str(e),
        recipient_list=["admin@example.com"]
    )
Integrating with Slack
Using Slack’s Incoming Webhooks, you can send messages directly to a Slack channel.
-
Create Slack App and Webhook URL:
- Go to the Slack API to create a new App.
- Navigate to "Incoming Webhooks" and create a new webhook URL.
-
Installing requests Library: Install the requests library to send HTTP requests.
pip install requests
-
Sending Slack Notifications:
import requests
import json

SLACK_WEBHOOK_URL = 'https://hooks.slack.com/services/your/webhook/url'

def send_slack_alert(message):
    payload = {
        "text": message
    }
    headers = {'Content-Type': 'application/json'}
    response = requests.post(SLACK_WEBHOOK_URL, data=json.dumps(payload), headers=headers)
    if response.status_code != 200:
        raise ValueError(f"Request to Slack returned an error {response.status_code}, the response is:\n{response.text}")

# Trigger Slack Alert
try:
    # Your code here
except Exception as e:
    send_slack_alert(f"Critical Error: {str(e)}")
Integrating with Prometheus and Grafana
Prometheus and Grafana offer a robust solution for real-time monitoring and alerting.
-
Set up Prometheus: Ensure Prometheus is configured to scrape metrics from your Django application. Add rules for alerting in Prometheus by updating its alert.rules configuration.
groups:
  - name: example_alerts
    rules:
    - alert: HighErrorRate
      expr: job:request_errors:rate5m{job="django-app"} > 0.05
      for: 5m
      labels:
        severity: page
      annotations:
        summary: "High error rate detected"
        description: "Error rate of job {{ $labels.job }} has been above 5% for the last 5 minutes."
-
Configure Alertmanager: Set up Alertmanager to handle alerts from Prometheus and route them to your preferred notifications channels, such as Slack or email.
global:
  resolve_timeout: 5m

route:
  receiver: 'team-X-mails'

receivers:
  - name: 'team-X-mails'
    email_configs:
    - to: 'team-email@example.com'
      send_resolved: true
      from: 'prometheus@example.com'
-
Integrate Grafana with Alertmanager: Create dashboards in Grafana and configure alerts based on your Prometheus metrics. Grafana will use the Alertmanager setup to send notifications.
apiVersion: 1
alert:
  condition: "avg() OF query(A, 15s, now) > 1"
  annotations:
    summary: "High CPU Usage"
    description: "CPU usage is above 1%"
  noDataState: NoData
  executionErrorState: Error
Best Practices for Alerts and Notifications
- Avoid Alert Fatigue: Ensure that alerts are meaningful and actionable; avoid sending too many non-critical alerts.
- Regular Testing: Regularly test alert mechanisms to confirm they work as expected.
- Detailed Messages: Include enough details in your alert messages to facilitate quick diagnosis and resolution.
By setting up these robust alerting mechanisms, you ensure that your Django application meets the SOC2 compliance requirements for monitoring and logging, enabling swift responses to incidents and maintaining system integrity.
Ensuring Data Integrity in Logs
Ensuring the integrity and security of log data is crucial for maintaining SOC2 compliance. Logs are fundamental for monitoring system behavior, enforcing accountability, and conducting forensic analysis in the event of security incidents. To guarantee data integrity, you will rely on secure logging practices and implement checksum or hash-based verification techniques. This section covers these key practices.
Secure Logging Practices
-
Access Controls: Restrict access to log files to authorized personnel only. This prevents unauthorized alterations and ensures accountability.
- File Permissions: Configure your Django application to set appropriate file permissions on log files.
import os
import logging
from logging.handlers import RotatingFileHandler

LOG_DIR = '/path/to/log/files'
os.makedirs(LOG_DIR, exist_ok=True)
log_file_path = os.path.join(LOG_DIR, 'application.log')

# Setting restrictive permissions
os.chmod(LOG_DIR, 0o700)
os.chmod(log_file_path, 0o600)

logger = logging.getLogger('django')
handler = RotatingFileHandler(log_file_path, maxBytes=10485760, backupCount=10)
logger.addHandler(handler)
-
Encrypted Logging: Encrypt sensitive log data at rest to ensure that unauthorized users cannot read or tamper with log files.
-
Using Libraries: You can utilize libraries like cryptography to encrypt log data before it is written to disk.
from cryptography.fernet import Fernet
import logging

key = Fernet.generate_key()
cipher_suite = Fernet(key)
logger = logging.getLogger('encrypted_logger')

class EncryptingHandler(logging.Handler):
    def emit(self, record):
        try:
            msg = self.format(record)
            encrypted_msg = cipher_suite.encrypt(msg.encode())
            # Write encrypted message to log file
            with open('encrypted_log.log', 'ab') as log_file:
                log_file.write(encrypted_msg + b'\n')
        except Exception as e:
            self.handleError(record)

handler = EncryptingHandler()
logger.addHandler(handler)
-
Transmission Security: Use secure protocols like TLS to transmit logs to remote servers or third-party logging services to prevent interception and tampering.
Hash-Based Verification
Hashing log entries ensures that any modification or tampering of log data can be detected. Here are the steps to implement hash-based verification:
-
Hashing Log Entries: Compute a hash for each log entry before writing it to the log file. Store this hash alongside the log entry.
 import logging
 import hashlib

 logger = logging.getLogger('hashing_logger')

 class HashingHandler(logging.Handler):
     def emit(self, record):
         try:
             msg = self.format(record)
             hash_object = hashlib.sha256(msg.encode())
             log_entry = f'{msg}|HASH={hash_object.hexdigest()}'
             # Write log entry with hash to log file
             with open('hash_log.log', 'a') as log_file:
                 log_file.write(log_entry + '\n')
         except Exception as e:
             self.handleError(record)

 handler = HashingHandler()
 logger.addHandler(handler)
-
Verifying Log Integrity: Periodically verify the integrity of log files by recomputing the hashes of logged entries and comparing them to the stored hashes.
 def verify_log_integrity(log_file_path):
     with open(log_file_path, 'r') as log_file:
         for line in log_file:
             log_entry, hash_tag = line.rsplit('|HASH=', 1)
             hash_object = hashlib.sha256(log_entry.encode())
             if hash_object.hexdigest() != hash_tag.strip():
                 raise ValueError(f'Tampered log entry detected: {log_entry}')

 verify_log_integrity('hash_log.log')
Conclusion
Implementing secure logging practices and hash-based verification techniques is vital for ensuring data integrity in logs, which is a key requirement for SOC2 compliance. By encrypting logs, controlling access, securing transmissions, and verifying log entries via hashing, you help maintain the trustworthiness of your log data, enabling accurate monitoring and effective incident response.
Audit Trails and User Activity Logs
Setting up audit trails and user activity logging is crucial for maintaining SOC2 compliance. Both audit trails and detailed user activity logs allow you to track and record vital user actions, providing a critical framework for compliance and forensic analysis. This section will guide you through the steps necessary to implement these features in your Django application.
Why Audit Trails and User Activity Logging Matter
Audit trails and user activity logs play an instrumental role in ensuring accountability and transparency. They help in:
- Tracking User Actions: Capturing actions like logins, logouts, data modifications, and transactions.
- Incident Response: Providing a timeline of events to help identify and mitigate security incidents.
- Compliance and Auditing: Demonstrating due diligence and governance in user activities to auditors.
- Forensic Analysis: Helping investigators understand the sequence of actions leading up to an incident.
Setting Up Audit Trails and User Activity Logging in Django
1. Creating a Custom Middleware
To capture and log user actions, you can implement a custom middleware in Django.
Create a new middleware class in your Django app:
import logging
from datetime import datetime

class UserActivityLoggingMiddleware:
    def __init__(self, get_response):
        self.get_response = get_response
        self.logger = logging.getLogger('user_activity')

    def __call__(self, request):
        response = self.get_response(request)
        user = request.user if request.user.is_authenticated else 'Anonymous'

        log_data = {
            'user': str(user),
            'path': request.path,
            'method': request.method,
            'timestamp': datetime.utcnow().isoformat(),
            'params': request.GET.dict(),
            'body': request.body.decode('utf-8') if request.body else '',
        }

        self.logger.info(log_data)

        return response
2. Configuring the Logger
In your settings.py file, configure the Django logging framework to handle user activity logs.
LOGGING = {
    'version': 1,
    'disable_existing_loggers': False,
    'handlers': {
        'user_activity_file': {
            'level': 'INFO',
            'class': 'logging.FileHandler',
            'filename': 'user_activity.log',
            'formatter': 'verbose',
        },
    },
    'formatters': {
        'verbose': {
            'format': '{levelname} {asctime} {module} {message}',
            'style': '{',
        },
    },
    'loggers': {
        'user_activity': {
            'handlers': ['user_activity_file'],
            'level': 'INFO',
            'propagate': True,
        },
    },
}
3. Installing the Middleware
Add your custom middleware to the MIDDLEWARE list in settings.py:
MIDDLEWARE = [
    ...
    'your_app.middleware.UserActivityLoggingMiddleware',
    ...
]
Advanced Techniques
Using Django Signals
Django signals allow you to handle various events, such as creating an audit log whenever a model instance is saved or deleted.
from django.db.models.signals import post_save, post_delete
from django.dispatch import receiver
from your_app.models import YourModel

@receiver(post_save, sender=YourModel)
def create_audit_log_on_save(sender, instance, created, **kwargs):
    action = 'Created' if created else 'Updated'
    logging.getLogger('user_activity').info({
        'action': action,
        'instance': str(instance),
        'user': instance.modified_by,
        'timestamp': datetime.utcnow().isoformat(),
    })

@receiver(post_delete, sender=YourModel)
def create_audit_log_on_delete(sender, instance, **kwargs):
    logging.getLogger('user_activity').info({
        'action': 'Deleted',
        'instance': str(instance),
        'user': instance.modified_by,
        'timestamp': datetime.utcnow().isoformat(),
    })
Ensuring Data Integrity in Logs
To ensure that your log data is tamper-proof, consider implementing checksum or hash-based verification.
Example Using SHA-256 Hash
import hashlib

def get_hash(log_entry):
    hash_object = hashlib.sha256(log_entry.encode())
    return hash_object.hexdigest()

log_entry = str(log_data)
log_hash = get_hash(log_entry)

with open('user_activity.log', 'a') as log_file:
    log_file.write(f"{log_entry} | hash: {log_hash}\n")
Conclusion
Proper implementation of audit trails and user activity logs not only helps in achieving SOC2 compliance but also strengthens your security posture against potential incidents. Follow the guidelines and examples provided above to ensure a robust logging framework for your Django application.
In the next section, we will discuss Load Testing with LoadForge to Ensure SOC2 Readiness, which is essential for verifying that your application can handle significant loads while maintaining compliance.
Load Testing with LoadForge for SOC2 Readiness
In this section, we will guide you through the process of performing load testing on your Django application using LoadForge. Ensuring your application can handle increased traffic volumes while maintaining SOC2 compliance standards is crucial. Proper load testing helps to identify potential bottlenecks and ensures that your infrastructure can meet the demands without compromising on the principles of SOC2: Security, Availability, Processing Integrity, Confidentiality, and Privacy.
Steps to Perform Load Testing with LoadForge
1. Setting Up LoadForge
To get started with LoadForge, you need to create an account and set up your first test. Follow these steps:
-
Sign Up for LoadForge:
Visit the LoadForge website and sign up for an account. Choose a subscription plan that fits your requirements.
-
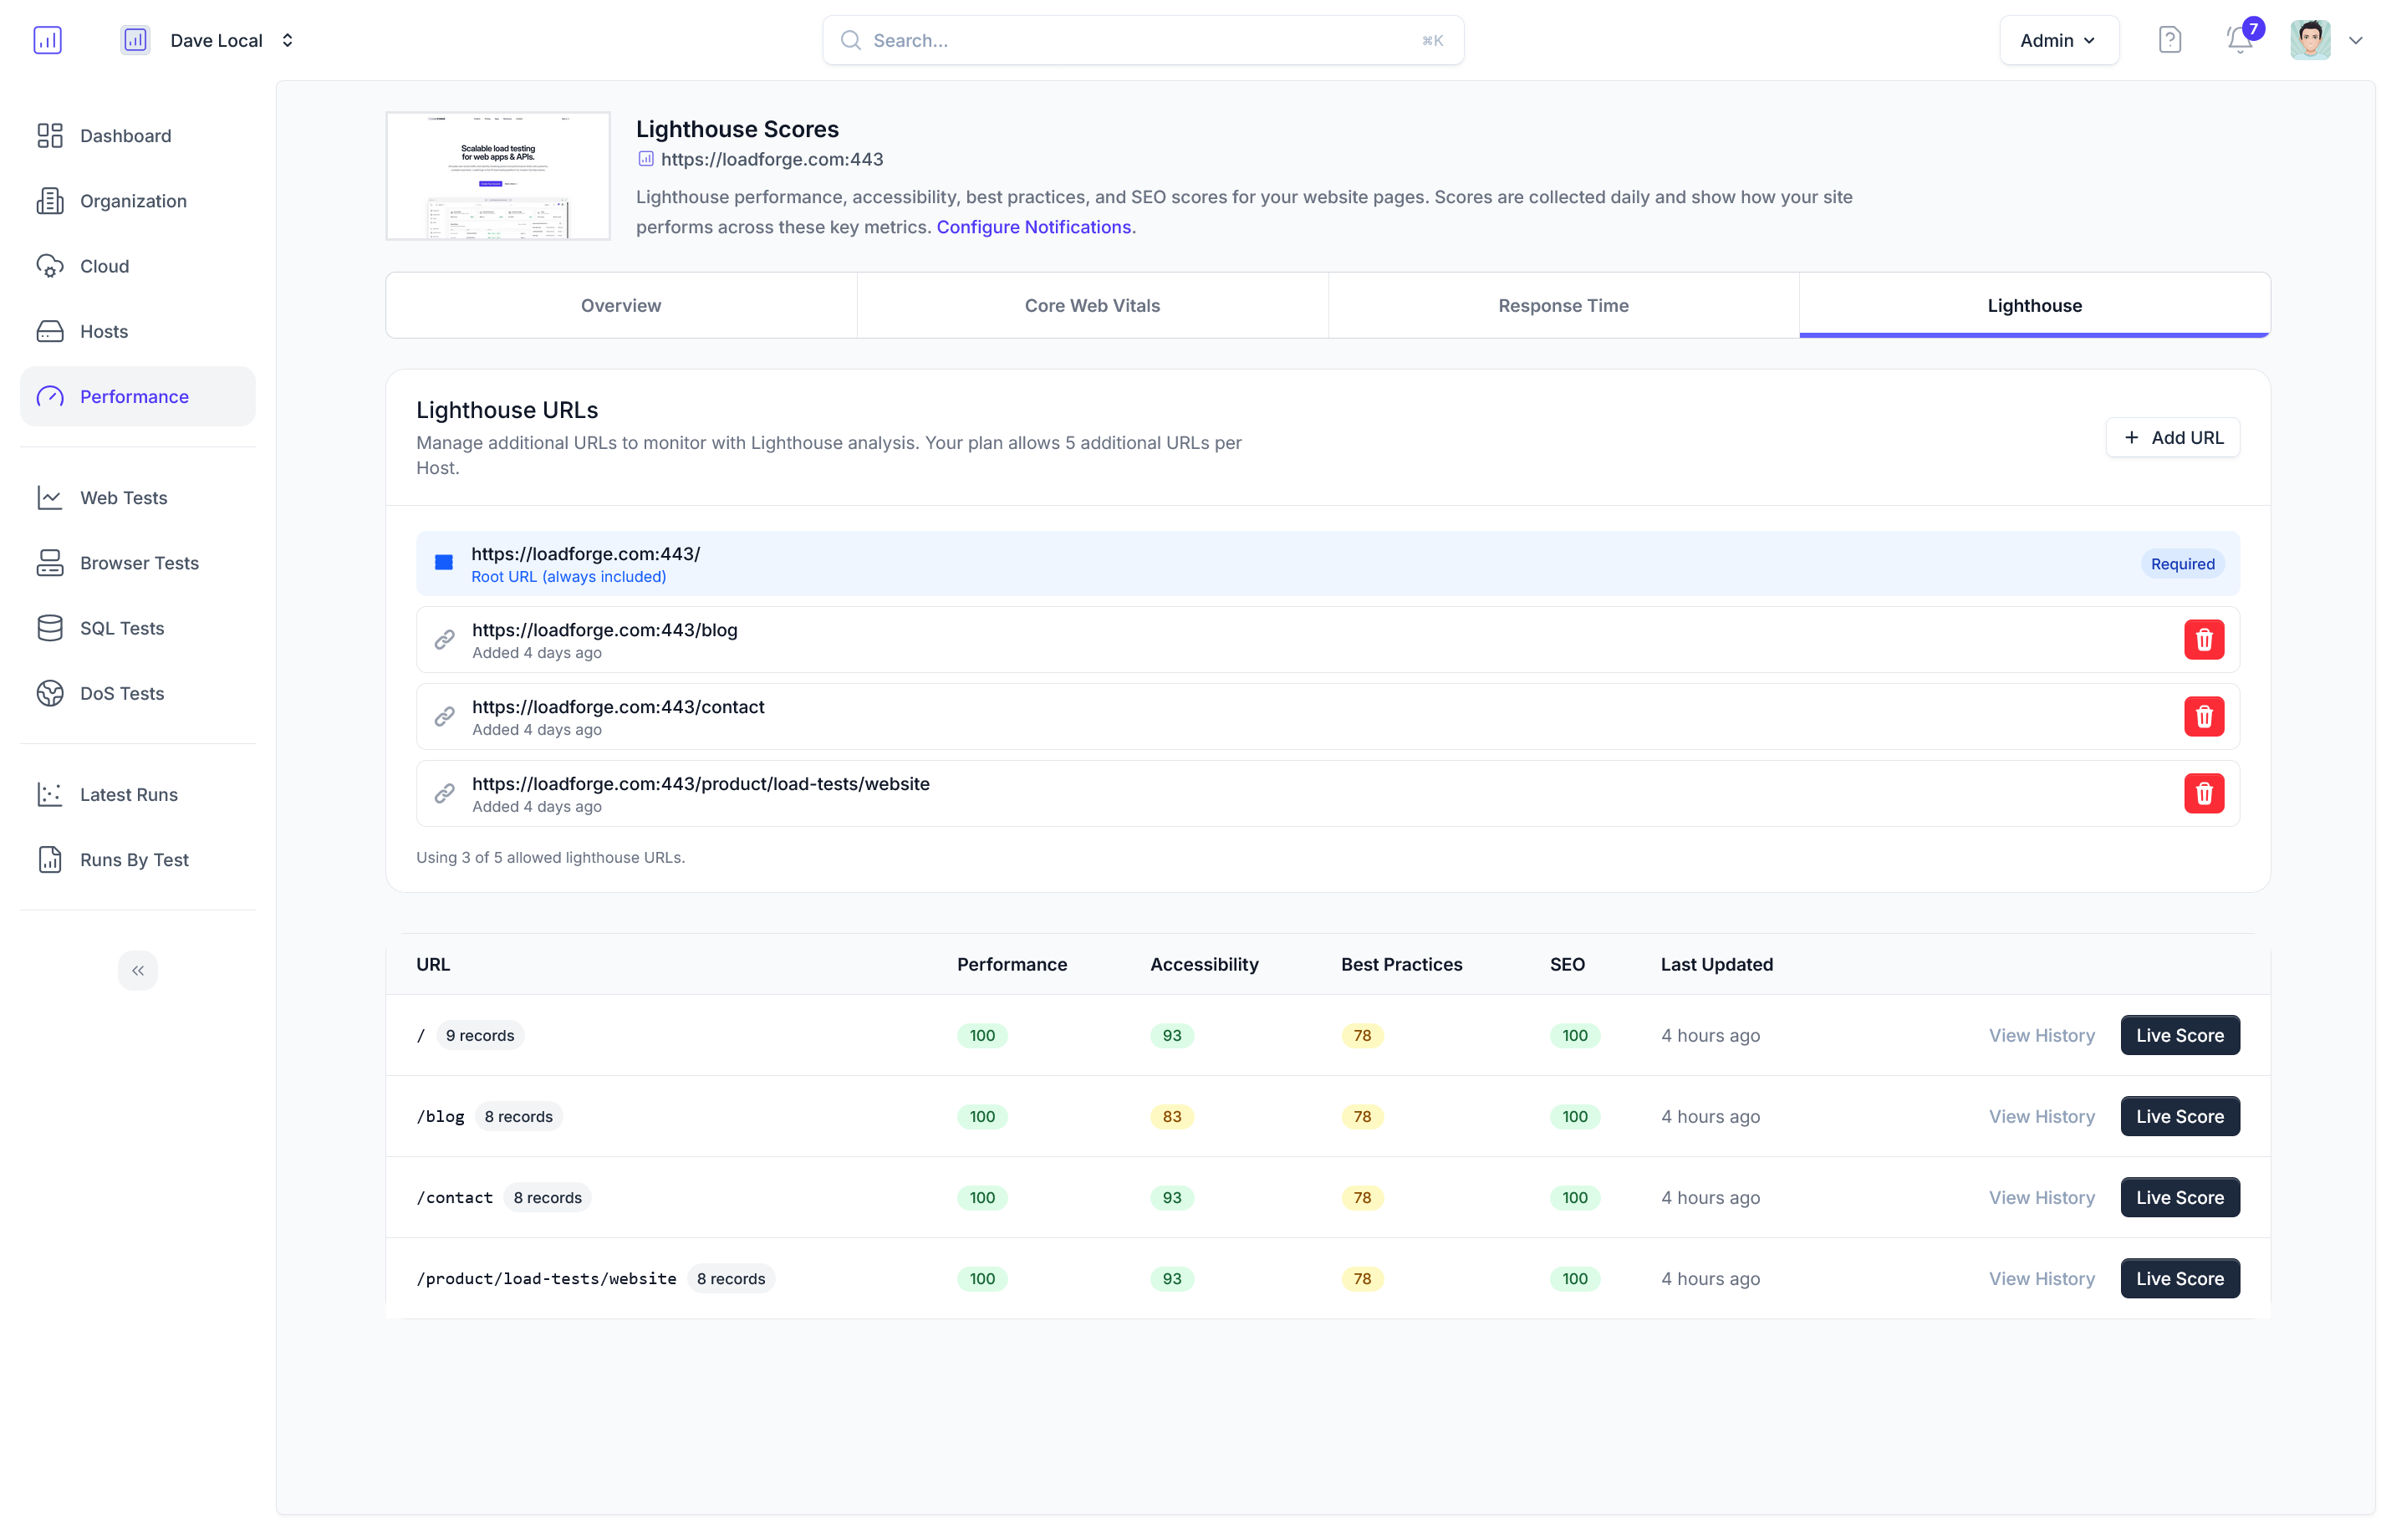
Create a New Test:
Once logged in, navigate to the dashboard and create a new test. You will need to provide details such as the name of the test, target URL (your Django application's URL), and the number of virtual users you wish to simulate.
-
Configure Test Parameters:
Configure the parameters for your test, including the test duration, ramp-up time (time taken to reach maximum load), and any specific scenarios or paths within your application that you want to test.
2. Integrating LoadForge with Your Django Application
To begin load testing, ensure your Django application is configured correctly to handle the simulated traffic. Follow these guidelines:
-
Ensure Monitoring is Enabled:
Make sure you have real-time monitoring and logging configured (as discussed in previous sections). This will help you track the application's performance during the load test.
-
Set Up Test Environment:
Use a staging environment that mirrors your production setup. This avoids potential disruptions to your live users and ensures you get accurate results.
3. Running the Load Test
-
Start the Test:
After configuring the test parameters, start the load test from the LoadForge dashboard. LoadForge will begin simulating traffic to your Django application.
-
Monitor Performance:
Utilize your monitoring tools (like Prometheus and Grafana) to observe how your application handles the load. Look out for metrics such as response time, error rates, CPU and memory usage, and database performance.
-
Log the Results:
Ensure all logs are being collected and stored securely. This includes access logs, error logs, and custom application logs, which help you analyze the performance and identify any issues.
4. Analyzing Load Test Results
Once the load test is complete, LoadForge will provide detailed reports on the performance of your Django application.
-
Review the Report:
Examine the LoadForge report to understand how your application performed under load. Pay attention to key metrics like average response time, peak response time, error rates, and throughput.
-
Identify Bottlenecks:
Analyze the logs and monitoring data to identify any bottlenecks or performance issues. Common issues include database slowdowns, insufficient scaling of web servers, or network latency.
-
Optimize Based on Findings:
Use the findings to make necessary optimizations. This might involve scaling your infrastructure, optimizing database queries, or updating your application code for better performance.
5. Ensuring SOC2 Compliance During Load Testing
During load testing, it is essential to maintain SOC2 compliance. Here are some critical points to ensure compliance:
- Security: Ensure all communications between LoadForge and your application are encrypted. Use SSL/TLS for data transmission.
- Availability: Confirm your application can handle the load without downtime, ensuring service availability.
- Processing Integrity: Verify that your application processes requests correctly under load without data corruption or loss.
- Confidentiality and Privacy: Maintain the confidentiality and privacy of any sensitive data during load testing. Ensure no real user data is exposed or compromised during the test.
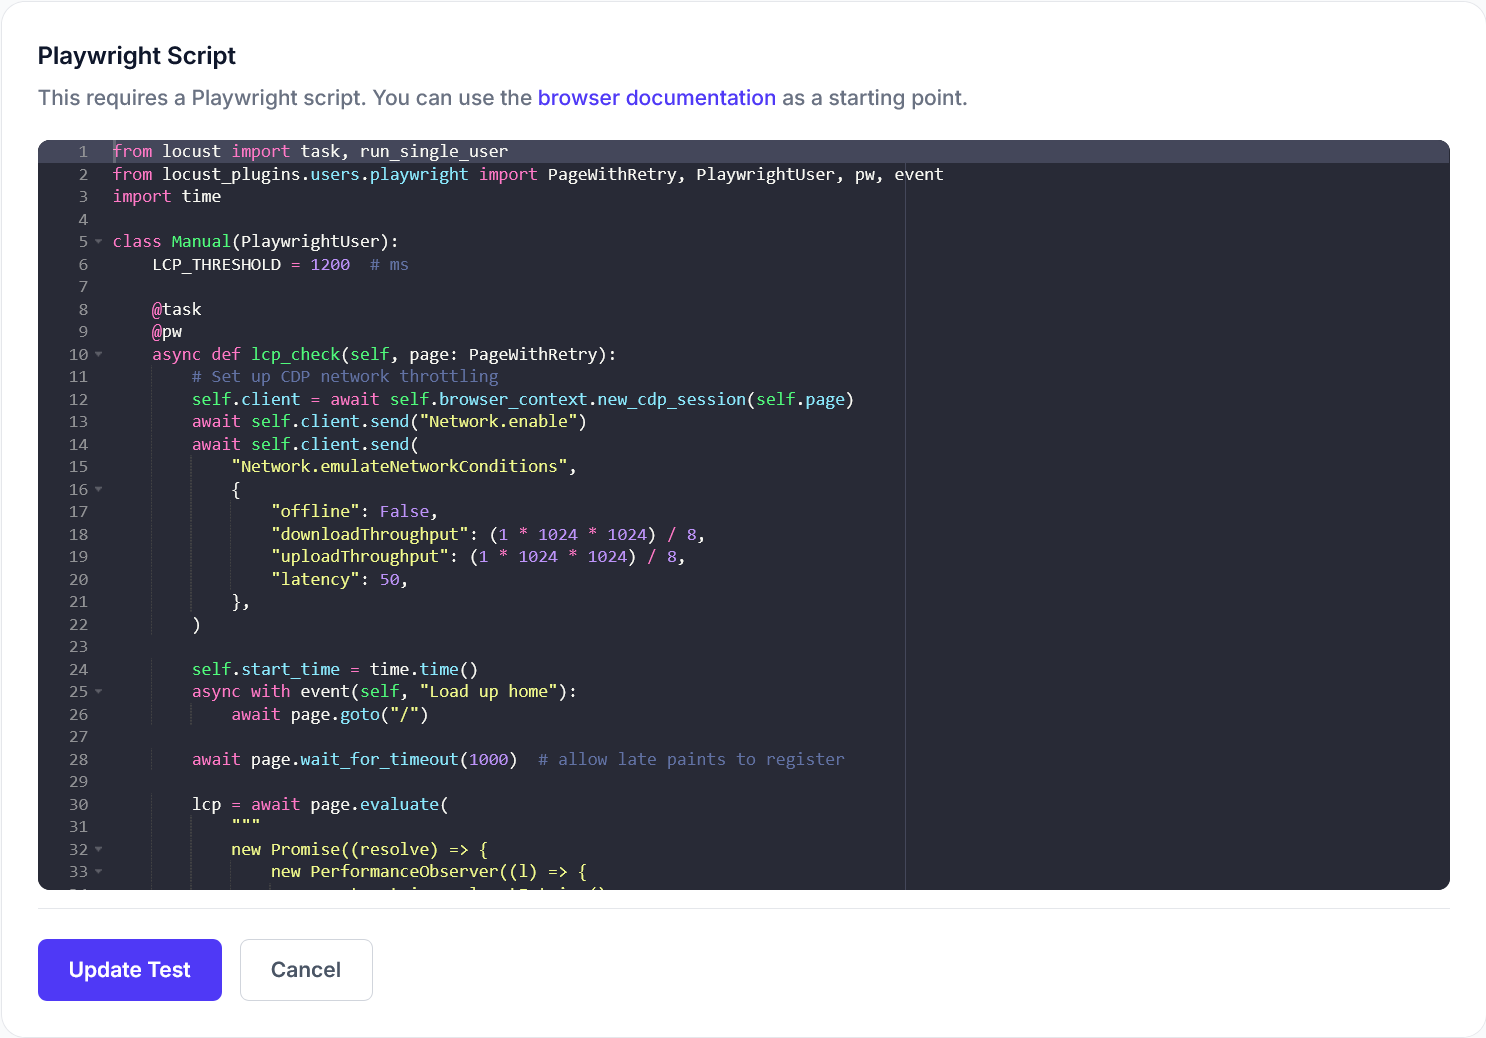
Example: Configuring a Load Test Scenario
Here is a simple Python script example to set up a test scenario with LoadForge using their API:
import requests

LOADFORGE_API_KEY = 'your_api_key'
LOADFORGE_TEST_ID = 'your_test_id'
DURATION = 300  # Test duration in seconds
USERS = 100  # Number of virtual users

url = f'https://api.loadforge.com/v1/tests/{LOADFORGE_TEST_ID}/run'
headers = {
    'Authorization': f'Bearer {LOADFORGE_API_KEY}',
    'Content-Type': 'application/json',
}

data = {
    'duration': DURATION,
    'virtualUsers': USERS,
}

response = requests.post(url, headers=headers, json=data)

if response.status_code == 200:
    print('Load test started successfully.')
else:
    print('Failed to start load test:', response.status_code, response.text)
Conclusion
Performing load testing with LoadForge is essential for ensuring your Django application can handle high traffic volumes while maintaining SOC2 compliance. By following the steps and guidelines in this section, you can effectively test and optimize your application, ensuring it meets the rigorous standards of SOC2. Regular load testing, combined with robust monitoring and logging practices, will help maintain the security, availability, and integrity of your web application.
Documenting Your Logging and Monitoring Setup
Documenting your logging and monitoring configurations is a critical aspect of maintaining SOC2 compliance. Proper documentation not only helps ensure your configurations are well-understood and repeatable but also demonstrates to auditors that your organization is committed to effective security practices. This section will guide you through the best practices for documentation and provide templates and examples of essential documentation items required for SOC2 audits.
Best Practices for Documentation
-
Clear and Concise Language: Write documentation in simple, clear language that is easy to understand. Avoid jargon and overly technical terms unless necessary.
-
Structured Format: Use a structured format that includes sections such as Overview, Purpose, Configuration Details, and Procedures. This helps in easy navigation and understanding.
-
Version Control: Maintain version control for all documentation. Clearly record the date of creation and any subsequent updates to ensure a historical trail.
-
Regular Updates: Document processes for regularly updating the logs and monitoring documentation to reflect current configurations and practices.
-
Accessibility: Ensure documentation is easily accessible to authorized personnel. Consider using a shared documentation platform like Confluence, GitHub, or an internal wiki.
Essential Documentation Items
Example: Logging Configuration Documentation
# Logging Configuration Documentation
## Overview
This document describes the logging configurations for the Django application, including log levels, handlers, and formatting.
## Purpose
The purpose of this documentation is to outline the logging setup in compliance with SOC2 requirements, ensuring all critical events are logged and monitored.
## Configuration Details
### Log Levels
- DEBUG: Used for detailed debugging information.
- INFO: General operational information.
- WARNING: Indicator of potential issues.
- ERROR: Error events that might allow the application to continue running.
- CRITICAL: Severe error events that will presumably lead the application to abort.
### Logger Configuration in settings.py
LOGGING = {
'version': 1,
'disable_existing_loggers': False,
'formatters': {
'verbose': {
'format': '{levelname} {asctime} {module} {message}',
'style': '{'
},
'simple': {
'format': '{levelname} {message}',
'style': '{'
},
},
'handlers': {
'console': {
'level': 'DEBUG',
'class': 'logging.StreamHandler',
'formatter': 'simple'
},
'file': {
'level': 'ERROR',
'class': 'logging.FileHandler',
'filename': '/var/log/django/error.log',
'formatter': 'verbose'
},
},
'loggers': {
'django': {
'handlers': ['console', 'file'],
'level': 'DEBUG',
'propagate': True,
},
}
}
Procedures
- Log File Rotation: Log files are rotated weekly to manage file size and retain important information.
- Log Review: Logs are reviewed on a weekly basis to identify and address any anomalies.
- Alerting: Alerts are configured for critical errors and forwarded to the designated response team via Slack.
Example: Monitoring Setup Documentation
# Monitoring Setup Documentation
## Overview
This document outlines the configuration for the monitoring system in place for the Django application, focusing on real-time monitoring and alerts.
## Purpose
To detail the monitoring setup required for ensuring availability and performance, as well as compliance with SOC2 standards.
## Configuration Details
### Prometheus Setup
- **Installation**: Prometheus installed on the monitoring server with the following configuration:
global:
scrape_interval: 15s
scrape_configs:
- job_name: 'django'
static_configs:
- targets: ['localhost:8000']
Grafana Dashboard
- Important Dashboards: Dashboards for CPU usage, Memory usage, Error rates, and Request latency.
- Alerts: Alerts configured in Grafana for metrics like CPU usage > 80%, Response time > 500ms.
Procedures
- Adding New Metrics: To add new metrics, update the Prometheus configuration and Grafana dashboard.
- Weekly Review: Metrics are reviewed weekly to identify patterns and potential issues.
- Alert Verification: Alerts are validated monthly to ensure they trigger correctly and reach the intended recipients.
Templates
Logging and Monitoring Policies Template
# Logging and Monitoring Policy

## Purpose
The purpose of this policy is to establish logging and monitoring practices to ensure compliance with SOC2 standards.

## Scope
This policy applies to all logging and monitoring activities within the Django application.

## Responsibilities
- **System Administrators**: Responsible for maintaining the logging and monitoring infrastructure.
- **Developers**: Responsible for ensuring the application logs critical events.
- **Security Team**: Responsible for reviewing logs and response to security incidents.

## Policies
1. **Log Retention**: Logs must be retained for a minimum of 90 days.
2. **Access Control**: Log access must be restricted to authorized personnel.
3. **Incident Response**: All critical log events must trigger an incident response.

## Procedures
- **Setup**: Detailed procedures for setting up logging and monitoring infrastructure.
- **Review**: Regular review procedures to validate the integrity and completeness of logs.
- **Incident Management**: Steps to manage incidents identified through logs and monitoring.
Following these best practices and using these templates should help ensure that your logging and monitoring setups are well-documented and compliant with SOC2 standards. Proper documentation is not only crucial for passing audits but also for maintaining robust security and operational practices.
Regular Review and Continuous Improvement
Achieving SOC2 compliance is not a one-time activity but requires ongoing diligence to maintain the standards and practices that ensure the security, availability, and integrity of your Django application. Regularly reviewing your monitoring and logging setup and striving for continuous improvement are critical components of this process. This section details strategies for systematic reviews, periodic audits, and continuous enhancements to your monitoring and logging practices.
Importance of Regular Reviews
Regular reviews help in:
- Identifying and addressing vulnerabilities or anomalies in logs.
- Ensuring that your logging and monitoring configurations remain aligned with evolving SOC2 requirements.
- Improving the efficiency and effectiveness of your incident detection and response efforts.
Establishing a Review Framework
A structured review framework helps in maintaining discipline and consistency in your review process. Here are the key steps:
-
Define Review Frequency:
- Daily: Ad-hoc reviews of critical logs.
- Weekly: Review alert configurations and triggered alerts.
- Monthly: Comprehensive review of all logs, metrics, and incidents.
- Quarterly: Full audit of monitoring and logging setups against SOC2 requirements.
-
Review Responsibilities:
- Assign clear responsibilities for the review process to team members.
- Maintain a log of reviews conducted, who performed them, and the outcomes.
Conducting Periodic Audits
Periodic audits play a vital role in assessing and ensuring SOC2 compliance. Here’s a step-by-step guide:
-
Audit Preparations:
- Gather all relevant logs and monitoring data.
- Ensure you have comprehensive documentation of your logging and monitoring configurations.
- Prepare a checklist of SOC2 requirements relevant to logging and monitoring.
-
Audit Execution:
- Verify that log entries are complete and formatted according to guidelines.
- Check for any missed or incorrectly logged events.
- Review the effectiveness of alerting mechanisms.
- Assess the integrity and protection measures of log data.
-
Post-Audit Actions:
- Compile an audit report highlighting findings and areas for improvement.
- Develop an action plan to address any identified gaps.
- Review and update documentation based on audit results.
Continuous Improvement Strategies
Continuous improvement ensures that your monitoring and logging practices evolve to meet new challenges and optimize performance.
-
Feedback Loop:
- Establish a feedback loop where insights from regular reviews and audits are used to update and enhance your monitoring and logging configurations.
- Encourage team members to contribute suggestions for improvements.
-
Adopt Best Practices:
- Stay informed about industry best practices in logging and monitoring.
- Incorporate new tools and methodologies that enhance your capabilities.
-
Training and Awareness:
- Regularly train your team on SOC2 requirements and the importance of robust logging and monitoring.
- Conduct awareness sessions on new updates or changes in your setup.
-
Automation and Tool Integration:
- Automate repetitive review tasks where possible to reduce human error and enhance efficiency.
- Regularly evaluate and integrate new tools that provide advanced capabilities for log analysis and monitoring.
Example Implementation
Here is a simple Python script to automate the weekly review of alert configurations and triggered alerts:
import logging
import os
import smtplib
from logging.handlers import RotatingFileHandler

# Example function to simulate alert review
def review_alerts(log_file):
    with open(log_file, 'r') as file:
        alerts = [line for line in file if 'ALERT' in line]
    return alerts

# Setting up logging
log_file = 'application.log'
handler = RotatingFileHandler(log_file, maxBytes=5000000, backupCount=5)
logging.basicConfig(handlers=[handler], level=logging.INFO)

# Reviewing alerts
alerts = review_alerts(log_file)

# Send a report if alerts found
if alerts:
    server = smtplib.SMTP('smtp.example.com', 587)
    server.starttls()
    server.login("your_email@example.com", "password")
    message = f"Subject: Weekly Alert Report\n\n{' '.join(alerts)}"
    server.sendmail("your_email@example.com", "recipient@example.com", message)
    server.quit()

logging.info(f"Weekly alert review completed. Alerts found: {len(alerts)}")
Documentation and Record Keeping
Keeping thorough records of your reviews, audits, and improvements is crucial for SOC2 compliance. This includes:
- Review logs and audit reports.
- Documentation of changes made to logging and monitoring configurations.
- Records of training sessions and meetings discussing SOC2 compliance.
Conclusion
Regular review and continuous improvement of your monitoring and logging setup are indispensable for maintaining SOC2 compliance. By adopting a structured approach to reviews, leveraging audits for deeper insights, and cultivating a culture of continuous enhancement, you can ensure that your Django application remains secure, reliable, and compliant.
Final Review and SOC2 Audit Preparation
Preparing for a SOC2 audit involves thorough review and meticulous organization of your logging and monitoring practices. This final phase ensures that your Django application is fully compliant and that all necessary documentation is in order. Follow these steps to streamline the process:
1. Review Logging Practices and Data Integrity
Ensure all your logging configurations are correctly set up and performing as expected:
- Check Log Levels: Verify that you have appropriate log levels set for different types of events (e.g., INFO, WARNING, ERROR).
- Log File Management: Ensure that log files are rotated and archived properly to prevent disk space issues.
- Data Integrity: Confirm that secure logging practices are in place, such as using checksums or hashes to verify the integrity of log data.
import hashlib

def verify_log_integrity(log_content, expected_hash):
    content_hash = hashlib.sha256(log_content.encode()).hexdigest()
    return content_hash == expected_hash

# Example usage
log_content = "User logged in"
expected_hash = "5d41402abc4b2a76b9719d911017c592"
is_valid = verify_log_integrity(log_content, expected_hash)
print("Log valid:", is_valid)
2. Validate Monitoring Configurations
Ensure that your monitoring tools are configured correctly and all key metrics are being tracked:
- Metric Coverage: Review all dashboards to ensure key performance metrics such as CPU usage, memory usage, and request latency are covered.
- Real-time Alerts: Confirm that alerts are set up for critical metrics and that notifications are being received by the appropriate personnel.
3. Ensure Documentation is Up-to-Date
Documentation is a crucial component of SOC2 compliance. Make sure all documentation is current and comprehensive:
- Logging and Monitoring Configuration: Document all configurations, including logging levels, monitoring tools, and alerting rules.
- Incident Response Plans: Ensure there are clear procedures documented for responding to security incidents, including who to contact and steps to take.
4. Conduct a Final Checklist Review
Perform a final review using a comprehensive checklist to ensure all aspects of your SOC2 compliance are covered:
Example Checklist:
| Item |
Status |
Comments |
| Appropriate log levels configured |
✅ |
Log levels set for all events |
| Log rotation and archival in place |
✅ |
Logs rotated daily |
| Log data integrity measures in place |
✅ |
Using SHA-256 hashes |
| Monitoring tools configured correctly |
✅ |
Prometheus and Grafana in use |
| Real-time alerts set up for key metrics |
✅ |
Alerts configured for CPU, RAM |
| Documentation up-to-date |
✅ |
All configurations documented |
| Incident response plans documented |
✅ |
Plans in internal wiki |
5. Conduct Internal Audits
Regular internal audits can help you find and fix issues before the official audit:
- Periodic Reviews: Schedule regular reviews of your logging and monitoring setup.
- Mock Audits: Conduct mock audits to simulate the SOC2 audit process and identify weak spots.
Preparing for the Official SOC2 Audit
When preparing for the official SOC2 audit:
- Audit Trail Compilation: Ensure that detailed audit trails and user activity logs are compiled and easily accessible.
- Final Documentation Review: Conduct a final review of all documentation to ensure completeness and accuracy.
- Engage with Auditors: Coordinate with your auditors, provide the required documentation, and be transparent about your processes.
By meticulously following these steps, you’ll be well-prepared for your SOC2 audit, ensuring your Django application meets the high standards of security, availability, processing integrity, confidentiality, and privacy required for compliance.