Introduction to API Load Testing
In the digital age, where applications and services are increasingly interconnected, the importance of robust API (Application Programming Interface) functionality cannot be overstated. APIs serve as the backbone of software communication, allowing different systems to interact and share data seamlessly. As such, ensuring that your APIs can withstand heavy loads and function effectively under pressure is crucial for maintaining the overall performance and scalability of your web applications. This is where API load testing comes into play.
Why is API Load Testing Important?
API load testing is a type of performance testing that simulates real-world load on an API to examine how the system behaves under significant, simultaneous usage. This is important because:
- Scalability: It checks whether the API can handle a large number of requests without compromising performance.
- Reliability: It ensures that the API remains stable and reliable under stressful conditions, which is crucial for user satisfaction and retention.
- Performance Optimization: Helps in identifying the performance bottlenecks and areas of improvement which can enhance the overall efficiency of the application.
Common Challenges in API Load Testing
Despite its importance, API load testing is often fraught with challenges that can impede the effectiveness of your testing strategy. Some common issues include:
- Complex User Scenarios: Simulating various real-user interactions can be complex as API calls often depend on multiple factors and previous responses.
- Data Management: Efficiently managing the data needed for tests, such as creating unique payloads, and handling data dependencies can be tedious and error-prone.
- Infrastructure Limitations: Without the right tools, scaling tests to realistically simulate high user loads can be challenging and expensive.
How LoadForge Can Help
LoadForge, a leading cloud-based load testing service, addresses these challenges head-on by leveraging the power of Locust, an open-source load testing tool. Here’s how LoadForge can dramatically streamline your API load testing process:
- Simplicity and Scalability: LoadForge allows you to easily define and run sophisticated API load tests from multiple locations around the world, handling the complexity of scaling and infrastructure management seamlessly.
- Cost-Effectiveness: By utilizing cloud resources, LoadForge enables you to perform large-scale load tests without the need for expensive hardware setups.
- Detailed Analytics: Post-test, LoadForge provides comprehensive analytics that helps in decisively pinpointing the bottlenecks and performance issues, thus aiding in rapid iterations and improvements.
In conclusion, API load testing is an integral part of ensuring the performance and scalability of your web applications. Challenges in testing can substantially impair the effectiveness of your APIs, impacting user experience and operational stability. LoadForge, through its efficient utilization of Locust, provides a robust solution that not only mitigates these challenges but also enhances your testing strategy, ensuring that your APIs can handle the demands of real-world usage. As we move forward, we'll dive deeper into the specifics of Locust, and how you can craft your first locustfile for API testing.
Understanding Locust for API Testing
Locust is an incredible open-source tool designed to perform load testing on a variety of online services, particularly excelling in testing APIs. Recognized for its flexibility and real-world user simulation, Locust makes it easier for developers and QA teams to understand how their API can withstand stress under varying conditions.
Key Features of Locust
Locust sets itself apart with several compelling features:
- User-friendly Scripting in Python: Tests are written in straightforward Python code, making it accessible for those who are already familiar with the language.
- Scalability: It can simulate millions of concurrent users with minimal CPU load by using coroutines.
- Distributed Testing: Large tests can be spread across multiple machines for concurrent execution, enhancing test realism and capacity.
Simulating API interactions with Locust
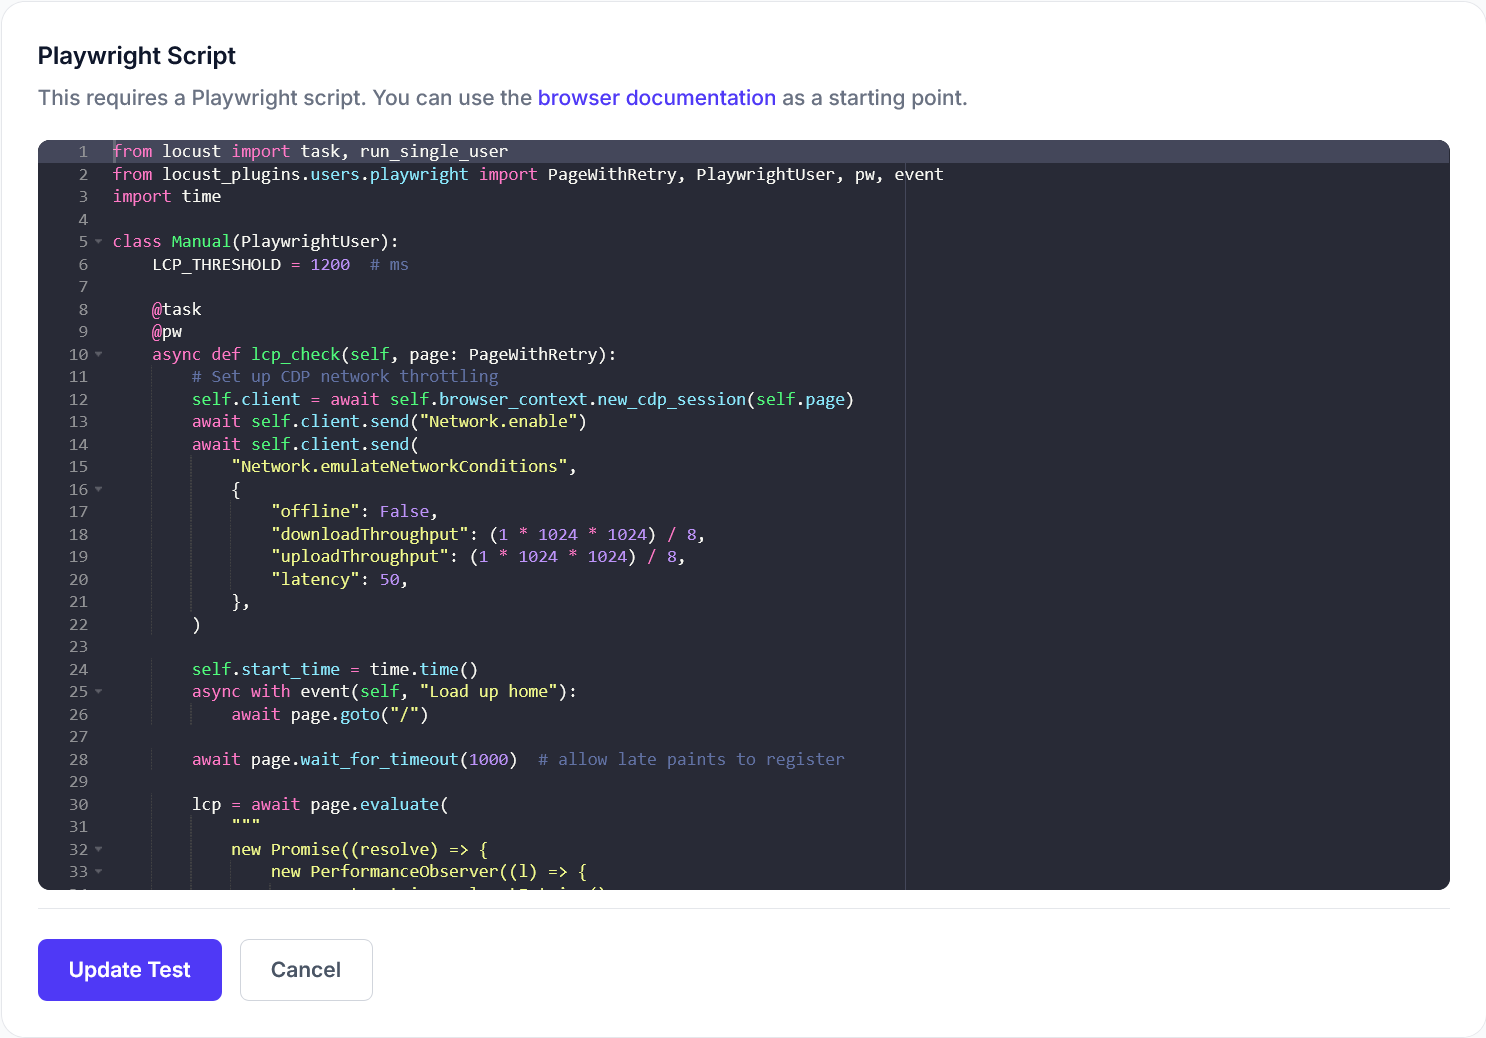
At its core, Locust uses tasks defined within Python classes to simulate user behavior. In the context of API testing, these tasks generally involve making various HTTP requests to API endpoints. Below is a simple example of a Locust test script designed to test an API:
from locust import HttpUser, task, between

class ApiUser(HttpUser):
    wait_time = between(1, 5)  # Simulate real user think-time between 1 to 5 seconds.

    @task
    def get_items(self):
        self.client.get("/api/items")  # Send a GET request to the API.

    @task(3)
    def create_item(self):
        self.client.post("/api/items", json={"name": "New Item", "description": "A new list item"})  # Send a POST request with JSON payload.
In this example:
HttpUser: Represents a user that makes HTTP requests.@task: A decorator used to denote a method that performs a certain task. The number (e.g., @task(3)) indicates the weight of the task, controlling how often it is executed relative to others.wait_time: Configures the time between the tasks, to simulate more realistic user behavior.
Integrating with LoadForge
Integrating Locust scripts into LoadForge provides a seamless transition from script creation to large-scale load testing. LoadForge leverages your Locust scripts to simulate traffic from multiple locations worldwide, effectively providing a detailed analysis of how well your API scales.
Steps for integration:
- Write your Locust script: Follow the guideline shown above to create your test scenarios.
- Upload to LoadForge: Through the LoadForge UI, you can upload your script directly.
- Configure your test: Specify the number of users, spawn rate, test duration, and the geographical distribution of load generators.
By connecting Locust with LoadForge's capabilities, testers can simulate a vast range of user behaviors and see how their APIs perform under pressure, benefiting from the scalability and distributed testing ability of LoadForge without needing the infrastructure to do this independently.
Designing Your First Locustfile
Creating a locustfile is your first step towards harnessing the power of LoadForge for API load testing. This script will dictate how virtual users interact with your API. Here, we will guide you through writing a simple locustfile that simulates various user behaviors to test the performance and resilience of your API.
Step 1: Define User Behavior
User behavior in locust is defined in a class that extends HttpUser. This class includes methods that simulate user interactions with your API. Each method represents a different type of API request.
Here’s an example to get you started:
from locust import HttpUser, task, between

class ApiUser(HttpUser):
    wait_time = between(1, 5)  # Simulate wait between 1 to 5 seconds between tasks

    @task
    def get_items(self):
        # This task simulates a GET request to /api/items
        self.client.get("/api/items")

    @task(3)
    def post_item(self):
        # This task simulates a POST request to /api/items
        # It's given a higher weight to run 3 times as often as get_items
        self.client.post("/api/items", json={"name": "newitem", "price": "10"})
In this script, @task decorator is used to define tasks. You can adjust the frequency of tasks by assigning weights (as we did with post_item).
Step 2: Making HTTP Requests
The HTTP methods such as get, post, put, delete are available through self.client. This is an instance of HttpSession and is used to make HTTP requests. You can include headers, query strings, JSON bodies, and more, based on your API requirements.
Step 3: Configuring the Test's Runtime and Number of Users
Configurations like the total number of users and the spawn rate can be defined outside the user class. These settings dictate how many simulated users will be created and at what rate.
Here’s how you can set these options:
from locust import HttpUser, task, between

class ApiUser(HttpUser):
    wait_time = between(1, 5)
    @task
    def get_items(self):
        self.client.get("/api/items")

    @task(3)
    def post_item(self):
        self.client.post("/api/items", json={"name": "newitem", "price": "10"})

import os

# Load settings from environment variables for scalability and convenience
host = os.getenv("TARGET_URL", "https://yourapihost.com")

# Number of total users and spawn rate can alternatively be specified in the command line arguments
# Example: locust -f locustfile.py --users 100 --spawn-rate 10
When you’d run Locust with this script, you would use the platform’s interface on LoadForge to set these parameters to best emulate real user behavior under high load conditions.
Summary
Writing your first locustfile involves:
- Defining user behavior and tasks that mimic real interactions with your API.
- Making HTTP requests within these tasks.
- Configuring the number of users and how fast they spawn.
This script serves as the blueprint for your load test, which you can fine-tune and scale according to your testing requirements. By leveraging Locust within LoadForge, these scripts can be easily deployed and managed, providing a robust environment for load testing your API across various conditions and loads.
Deploying Your Test in LoadForge
Once you have designed your Locustfile, deploying it on LoadForge is a straightforward process that enables you to test the scalability and performance of your API from different geographic locations. This section will guide you through uploading your Locustfile, configuring your test parameters, and executing the test.
Step 1: Uploading Your Locustfile
To begin, you need to upload the Locustfile you have created to the LoadForge platform. Follow these steps:
- Log in to your LoadForge account.
- Navigate to the Scripts section in the dashboard.
- Click on New Script.
- You will see a form where you can enter the name of your test script and the script content itself.
- Copy and paste the content of your Locustfile into the script content box.
- Save the script by clicking Create Script.
Step 2: Configuring Your Test
After your script is uploaded, the next step is to configure your test. LoadForge provides various configuration options that allow you to customize the test according to your needs.
-
Number of Users: Specify how many concurrent users you want to simulate. This number should reflect the load you want to test against your API.
-
Spawn Rate: Define how quickly users will be spawned. A higher rate will increase the load more quickly.
-
Test Duration: Set the duration for which the test should run. This could be in seconds, minutes, or hours.
-
Host: Input the base URL of the API you are testing. Ensure this is correctly formatted.
Selecting Test Location
LoadForge allows you to choose the geographic location of the servers from which the test is run. This is crucial for understanding how your API performs in different regions:
- Go to the Test Location field in the test setup.
- Select the desired geographic location from the dropdown menu. Multiple selections can be made if you want to simulate load from various regions.
Step 3: Launching Your Test
With the script uploaded and the test configured, you are now ready to launch:
- Review all settings to make sure they are correct.
- Click on Start Test. This will queue your test, and LoadForge will begin executing it as per the configurations.
- You can monitor the test progress in real-time on the dashboard.
Conclusion
LoadForge simplifies the deployment of load tests significantly. By following the above steps, you can easily set up and execute a comprehensive load test on your API from various global locations. Proper configuration will help you gain meaningful insights into the performance and robustness of your application under different load conditions. Remember, the key to a successful load test is in the details—ensure your configurations accurately represent the load conditions you expect your API to handle in production.
Analyzing Your Test Results
Once your LoadForge test has concluded, it's crucial to understand the resultant data to gauge the performance and robustness of your API. Proper analysis of the test results will enable you to identify potential bottlenecks, understand the scalability of your application, and ensure that your API can handle the expected load. LoadForge provides detailed metrics and graphs, which can be meticulously analyzed to derive meaningful insights.
Understanding Key Metrics
1. Response Times
The response time is a critical metric that measures the time taken for an API to respond to a request. This metric is typically presented in milliseconds (ms) and is crucial for assessing the performance of your API under various load conditions. High response times may indicate processing or network bottlenecks.
2. Requests Per Second (RPS)
This metric shows the number of requests that your API is handling per second. It is a direct indicator of the throughput of your application. A higher RPS value signifies better performance and higher capacity to handle concurrent users.
3. Failure Rate
The failure rate is expressed as a percentage and indicates the proportion of request failures compared to the total number of requests. Frequent failures could suggest issues with the API endpoints, server errors, or network problems.
Interpreting Graphs
LoadForge provides visual graphs that plot these metrics over the duration of the test. Here's how to interpret each:
-
Response Time Graph: This graph helps in identifying patterns or spikes in response times. Sudden increases can be indicative of performance issues when the load increases.
-
Throughput Graph (RPS): Analyze how the requests per second fluctuate during the test. Ideally, the RPS should remain consistent or scale smoothly as user load increases.
-
Error Rate Graph: This illustrates the failure rate throughout the test. Spikes in errors need to be investigated to ascertain their cause, whether they're due to load spikes, configuration errors, or other issues.
Example: Analyzing a Response Time Graph
If you're examining a response time graph and notice a significant spike at certain points:
| Time (min) | Response Time (ms) |
|------------|--------------------|
| 1          | 120                |
| 2          | 130                |
| 3          | 500                |  // Noticeable spike
| 4          | 140                |
In such a scenario, consider what occurred at minute 3. Was there a peak in user load, or perhaps a particular type of request that takes longer to process?
Actionable Insights
Post analysis, it’s crucial to translate these data points into actionable insights:
- Optimize Response Times: If certain API endpoints consistently show delayed responses, consider optimizing queries, upgrading server resources, or implementing caching where feasible.
- Address High Failure Rates: High error rates can degrade user experience. Delve into the logs to identify the errors and rectify them.
- Scalability Planning: If the system handles increasing loads well up to a point and then degrades, plan for scalable solutions like load balancers or more robust infrastructure.
Each test and its corresponding analysis not only provide insights into the present performance but also guide enhancements for future robustness and scalability. Use LoadForge’s detailed reporting tools to make informed decisions that ensure your API’s efficiency and reliability under varying load conditions.
Optimizing Your API Based on Test Findings
Once you have conducted your API load tests using LoadForge, the next crucial step is to analyze and utilize the data collected to optimize your API’s performance. The insights gained from the test results can be pivotal in identifying bottlenecks, understanding performance thresholds, and scaling your infrastructure efficiently. Here’s how you can begin optimizing your API based on these findings:
Identify Bottlenecks
The first step in optimization is to identify the bottlenecks in your system. These are typically the points within your system that limit the overall performance and could potentially lead to significant slowdowns when under load.
- Response Times: Look for endpoints that have significantly higher response times than others. These are often indicative of bottlenecks.
- Error Rates: High error rates can suggest issues like resource limitations (e.g., database connections), inadequate error handling, or logic errors in the API.
- Resource Utilization: Monitor the utilization of CPU, memory, and network. Spikes in usage can point to resource-heavy operations which need optimization.
Understand Performance Thresholds
Performance thresholds are the limits at which your API’s performance starts to degrade. Knowing these can help in effective capacity planning.
- Concurrent Users: Identify the maximum number of users your API can serve smoothly without significant performance drop-offs.
- Requests Per Second: Determine how many requests per second your API can handle before the response time or error rate begins to increase.
Scaling Your Infrastructure
Based on the bottlenecks and performance thresholds identified, plan for scaling your infrastructure:
- Horizontal vs. Vertical Scaling: Decide whether you need more servers (horizontal scaling) or more powerful servers (vertical scaling).
- Load Balancers: Implement load balancers to distribute traffic evenly among your servers, which helps in handling more load without straining a single server.
- Caching: Use caching mechanisms to reduce database load and to serve frequent requests efficiently.
Tips for Continuous Improvement
- Iterative Testing: Regularly run load tests to track the performance over time and understand the impact of any changes to the API or infrastructure.
- Code Profiling: Use profiling tools alongside your tests to pinpoint inefficient code paths or algorithms.
- Automate Performance Regressions: Set up thresholds in your testing scripts to automatically flag performance regressions.
Example: Analyzing Load Test Results
Consider this simple way to track response times which could indicate potential bottlenecks:
from locust import HttpUser, task, between

class WebsiteUser(HttpUser):
    wait_time = between(1, 5)

    @task
    def view_item(self):
        self.client.get("/api/item/view", name="View Item")

    @task(3)
    def view_dashboard(self):
        response = self.client.get("/api/dashboard/view", name="View Dashboard")
        if response.elapsed.total_seconds() > 2:
            print("Performance bottleneck detected at: View Dashboard")
This script uses Locust to test two API endpoints, flagging if the 'View Dashboard' takes longer than expected to respond, thereby simplifying the process of identifying bottlenecks.
By leveraging the comprehensive testing features of LoadForge and systematically analyzing the data from your tests, you can ensure that your API remains robust, scale-appropriately, and delivers a high-quality experience to its users.