Introduction to HAR Files
HTTP Archive (HAR) files are a vital tool in web development and analysis, providing a snapshot of a browser's interactions with a website during a session. These files record all the requests sent from the browser to the server and the corresponding responses it receives. By encapsulating detailed information about each web request and response, including timing data, headers, cookies, and body content, HAR files offer a comprehensive view of web performance.
What are HAR Files?
A HAR file is a JSON formatted log of a web browser's interaction with a site, adhering to a specific schema. This file is standard among different browsers, which makes it an invaluable tool for cross-browser testing and debugging. It captures not just the essence of what data is transferred, but also when and how it happens during the interaction between the browser and the server.
Why are HAR Files Useful?
HAR files are predominantly used for performance analysis, enabling developers and system administrators to:
- Identify Slow Load Times: By observing the time it takes for resources to load, developers can pinpoint bottlenecks in content delivery.
- Analyze API Calls: Developers can review API request and response data, headers, and status codes to ensure that APIs behave as expected under different conditions.
- Debug Network Activity: It is easier to see what happens at each step of a network request, facilitating a deeper understanding of issues like failed requests or unexpected responses.
- Optimize Resources: Analyzing file sizes, download times, and caching headers helps in optimizing the resources, thus enhancing the overall website performance.
Utilizing HAR Files to Diagnose Web Performance Issues
The structured nature of HAR files makes them extremely useful for diagnosing a variety of web performance issues. For example, they can help diagnose:
- Slow server response times: Time details allow you to see delays in server response which might indicate server configuration or performance issues.
- Resource bottlenecks: Detailed resource loading information helps in identifying if specific file types or third-party services are causing load delays.
- Inefficient caching mechanisms: HAR files show caching behavior of the browser and help assess if the caching strategy needs refinement.
By leveraging HAR files, developers and performance engineers can take a methodical approach to identify and rectify performance bottlenecks, ensuring the application performs optimally under various conditions. This leads to an improved user experience and potentially higher SEO rankings due to better page load times.
In the next sections, we'll go through the steps required to generate and analyze these powerful files using Chrome, then utilize this data to simulate real-world load scenarios and perform advanced analysis using tools like LoadForge to ensure your applications are not just functional but highly performant.
Preparing Your Chrome Browser
Before you begin recording a HAR file in Chrome, it is important to configure your browser to ensure that the data captured reflects a realistic user interaction without any distortion due to browser caching or extensions that might alter the browsing experience. Here are the steps to preparing your Chrome browser:
Disable Cache
To prevent Chrome from caching resources, follow these steps:
- Open Chrome and navigate to the webpage where you wish to start recording.
- Press
F12 or right-click anywhere on the page and select Inspect to open Developer Tools.
- Go to the
Network tab.
- Check the
Disable cache box located just below the network panel's primary menu. This ensures that all resources are fetched directly from the network, mirroring a first-time visitor's experience.
Disable Extensions
Extensions can modify how pages load and behave, which can affect your HAR data. Disable them by following these instructions:
- Open a new tab in Chrome and type
chrome://extensions/ in the address bar and press Enter.
- This page displays all installed extensions. Temporarily disable all extensions by clicking the toggle switch at the bottom of each extension card. Remember which ones were active if you want to re-enable them after recording.
Open Incognito Mode
Using an Incognito window can also help in reducing interference from browser extensions and cache:
- Click on the three dots at the top right corner of your Chrome browser.
- Select
New Incognito Window from the menu.
- Repeat the steps to disable cache within this new window as some cached data and extensions might still operate in incognito mode.
Set Up Developer Tools
Finally, setting up Developer Tools properly will help you capture all necessary data:
- With Developer Tools open (from the steps above), ensure you are in the
Network tab.
- Click on the gear icon or
More tools at the top-right corner of the Developer tools.
- In the settings that appear, ensure that
Preserve log is checked. This setting makes sure that the network log is not cleared upon navigation, which is important for capturing a complete set of interactions.
Using these setup steps ensures that your Chrome browser is ready to record the HAR file without any unwanted interference. This preparation helps in capturing a realistic view of the request and response data that your website generates, enabling accurate performance analysis.
Recording the HAR File
Generating a HAR file in Google Chrome involves capturing a record of all the interactions your browser has with a specific webpage. This can pinpoint performance issues and provide insights into your site’s load times, resource loading, and more. Below are the step-by-step instructions to record your browser activities and create a HAR file.
Step 1: Open Developer Tools
First, you need to access Chrome’s Developer Tools, which provide a set of web authoring and debugging tools built into the browser.
- Open Google Chrome.
- Navigate to the page where you want to start recording.
- Either right-click on the webpage and select
Inspect or press Ctrl + Shift + I (Cmd + Option + I on macOS) to open the Developer Tools.
Step 2: Go to the Network Tab
Inside the Developer Tools, you will find several tabs such as Elements, Console, Sources, and Network.
- Click on the
Network tab. This tab will show you all the network requests made when the webpage is loaded.
Step 3: Prepare the Browser
Before recording, it’s crucial to ensure that you’re capturing fresh data. This means eliminating cached data which can interfere with your recording.
- With the Network tab open, look for a round record button at the top-left corner of the tab (it should be red when recording). Next to the record button, there is a checkbox labeled
Disable cache.
- Check the
Disable cache box. This ensures the browser fetches all resources from the network and not from the cache.
Step 4: Start Recording
Now you’re ready to start recording your session to generate the HAR file:
- Ensure the record button is clicked. It will turn red when it is actively recording.
- Refresh the page to start capturing the network traffic related to the webpage’s load process.
Step 5: Reproduce the Issue or Complete the User Actions
Navigate through the site as necessary to reproduce the issue you are analyzing or to complete the actions for which the network performance needs auditing. The Developer Tools will record all network activity during this time.
Step 6: Stop Recording
Once you have completed the necessary actions on your site:
- Return to the Developer Tools window.
- Click the red record button again to stop recording. The button will turn grey to indicate that recording has stopped.
Step 7: Save the HAR File
After stopping the recording, you can save the results:
- Right-click anywhere on the grid of network requests.
- Select
Save all as HAR with content.
- Choose your desired save location and save the file.
This HAR file now contains all recorded data about the browser's interactions during your session, which you can use for further analysis or share with your development team to troubleshoot performance issues.
These simple steps allow you to capture comprehensive insights into the network activities of your website, which are invaluable for diagnosing performance problems and optimizing your web applications.
Saving and Reviewing the HAR File
Once you have successfully recorded the interactions on your website using Chrome's Developer Tools, the next crucial steps are saving the HAR file and learning how to efficiently review the data it contains. This section will guide you through these processes.
Saving the HAR File
After recording your browser activity, you need to save the HAR file to your local machine or a designated storage area for later analysis. Here's how you can do this:
- Stop Recording: Ensure you stop the recording by clicking the red record button again in the Network tab of Chrome's Developer Tools if it is still active.
- Right-click Inside the Network Tab: Anywhere on the grid of network requests, right-click to bring up a context menu.
- Save as HAR with Content: Choose 'Save all as HAR with Content' from the context menu. This option ensures that your HAR file includes all textual content from the recorded network requests.
A file save dialog will appear, prompting you where to save the HAR file. Choose a suitable location where you can easily access it for analysis.
Reviewing the HAR File
Reviewing a HAR file can initially seem daunting due to the volume of detailed information it presents. However, with a systematic approach, you can navigate through this data to diagnose performance issues effectively.
- Open the HAR file: You can open HAR files with various tools designed for performance analysis, such as HAR analyzers online, or simply using text editors for a more manual approach.
- Examine the Requests: Focus on parameters such as request and response headers, the size of responses, and the time taken for each request. These metrics are fundamental to understanding bottlenecks.
- Look for Long Load Times: Identify any files or API calls that take an unusually long time to complete. These are likely candidates for optimization.
- Check for Status Codes: Response status codes can tell you a lot about what went wrong during the request-response cycle. For example, a series of 404 errors might indicate missing resources, while 500 errors suggest server-side problems.
- Timeline Analysis: Most HAR viewer tools provide a timeline feature where you can see the sequence of requests and their durations visually. This can help in understanding how resources are loaded over time.
Here’s an example of a typical entry when you open a HAR file in a JSON format viewer:
{
  "startedDateTime": "2020-01-01T12:00:00.000Z",
  "time": 50,
  "request": {
    "method": "GET",
    "url": "http://example.com",
    "httpVersion": "HTTP/1.1",
    "headers": [],
    "queryString": [],
    "cookies": [],
    "headersSize": 150,
    "bodySize": 0
  },
  "response": {
    "status": 200,
    "statusText": "OK",
    "httpVersion": "HTTP/1.1",
    "headers": [],
    "content": {
      "size": 500,
      "mimeType": "text/html"
    },
    "redirectURL": "",
    "headersSize": 160,
    "bodySize": 5000,
    "cookie": []
  },
  "cache": {},
  "timings": {
    "blocked": 0.5,
    "dns": -1,
    "connect": 15,
    "send": 20,
    "wait": 500,
    "receive": 5,
    "ssl": -1
  },
  "pageref": "page_3"
}
Practical Tips for Efficient HAR Analysis
- Filter out irrelevant data: Most tools provide features to filter out data, such as by type of resource (CSS, JavaScript), which can simplify the visualization.
- Comparison: Compare HAR files from different test runs to understand how changes in your deployment or configuration impact performance.
- Automated Analysis Tools: Utilize automated analysis tools that can provide insights and recommendations based on the data captured in HAR files.
Remember, the key to effective HAR analysis lies in a methodical review process focused on identifying patterns or anomalies that could signify underlying performance issues.
Analyzing HAR Data
Once you have recorded and saved a HAR file from your Chrome browser, the next step is to analyze the data to understand specific website performance issues. HAR files provide a wealth of information about the HTTP requests and responses sent and received by your browser, which can help you pinpoint areas for optimization.
Key Components of HAR Files
To begin, it's important to familiarize yourself with the key components within a HAR file that are crucial for performance analysis:
- Entries: Each entry in a HAR file represents an individual HTTP request. Critical data in each entry include request and response headers, timings, and status codes.
- Timings: This object within each entry provides detailed timing information about the various stages of the request, such as
blocked, dns, connect, send, wait, and receive. Understanding these timings can help identify delays in the loading process.
- Headers: Both request and response headers can tell you a lot about cache usage, content type, and the size of data transferred, which are vital for diagnosing performance issues.
- ContentSize: This field records the size of the returned content. Large content sizes can be a primary factor in slow load times.
Steps to Analyze HAR Data
-
Identify Slow-Loading Resources:
- Sort the entries by the
wait or receive time to find out which resources take the longest to load. Larger times may indicate network or server-side problems.
-
Review HTTP Status Codes:
- Look for 4xx and 5xx errors that may impact the user experience. These could point to broken links or server errors that need immediate attention.
-
Examine Cache Behavior:
- Check the
cache-control and pragma headers to ensure that caching is properly configured. Effective use of cache can significantly reduce load times.
-
Analyze Header Sizes:
- Large request or response headers might contribute to increased latency. Optimizing these can enhance overall performance.
-
Investigate Sequence of Loaded Resources:
- The order in which resources load is crucial for perceived performance. Script files blocking the loading of other resources might require deferment or asynchronous loading.
Example of Analyzing a Sample Entry
Here’s a look at how you would analyze a sample entry from a HAR file:
{
  "startedDateTime": "2021-07-28T12:03:34.123Z",
  "time": 145.67,
  "request": {
    "method": "GET",
    "url": "http://example.com",
    "headersSize": -1,
    "bodySize": 0
  },
  "response": {
    "status": 200,
    "statusText": "OK",
    "headersSize": -1,
    "bodySize": 1256
  },
  "timings": {
    "blocked": 0.780,
    "dns": -1,
    "connect": 15.2,
    "send": 0.56,
    "wait": 92.82,
    "receive": 35.85
  },
  "cache": {},
  "serverIPAddress": "93.184.216.34",
  "_weight": 1532
}
From this entry, you can see key factors such as the time taken to connect (connect), time waiting for a response (wait), and the time to receive the data (receive). The status code is 200, indicating the request was successful.
Conclusion
Analyzing HAR data offers a deep dive into the inner workings of your web requests and responses. By understanding what each metric and value represents, you can effectively diagnose and address performance issues, leading to a more optimized user experience.
Common Problems Detected with HAR Files
When analyzing website performance, HAR (HTTP Archive) files are indispensable tools that provide granular details about each resource loaded by the browser. Through comprehensive examination of HAR files, developers can identify several common performance bottlenecks and issues that may be affecting user experience. Below, we detail some of the frequent problems detected by evaluating HAR files:
Slow Server Response Times
One of the most critical parameters visible in a HAR file is the time it takes for servers to respond to requests. This metric is often recorded as wait or time-to-first-byte (TTFB). Elevated values in these areas generally indicate server-side inefficiencies, which could be due to unoptimized database queries, inadequate server resources, or poor load distribution.
Example of extracting TTFB from a HAR file:
<pre><code>{
  "log": {
    "entries": [
      {
        "timings": {
          "wait": 200
        },
        "startedDateTime": "2023-10-07T12:00:00Z",
        "time": 250
      }
    ]
  }
}
</code></pre>
Resource Bottlenecks
Heavy or inefficient use of resources such as images, CSS, or JavaScript can significantly slow down your site. HAR files conveniently breakdown the size and request time of each resource, making it easier to spot any files that are unusually large or slow to load. Prolonged receive times or large file sizes in the HAR entries are usually red flags that these resources need compression or better optimization.
Frequent Redirects
Multiple or unnecessary redirects can also lead to increased load times, diminished user experience, and lower SEO rankings. HAR files document each redirect, showing both the initial and subsequent URLs along with the time taken for each redirect. Monitoring and minimizing these can significantly improve site responsiveness.
High Time to Interactive (TTI)
TTI is a critical measure that indicates the time it takes for a page to become fully interactive. Although not directly shown in HAR files, you can indirectly gauge it by looking at scripts and document load times. Long script durations can delay interactivity, suggesting the need for script optimization or deferment.
Unoptimized Cache Policies
Caching is vital for enhancing repeat visit speeds and reducing server loads. HAR files show cache-control headers and expires values that are essential for determining the efficiency of caching policies. Suboptimal settings here could lead to frequent resource reloads, undermining performance benefits.
Connection Reuse and SSL/TLS Negotiations
HAR files indicate whether connection reuse (keep-alive) is effectively implemented along with the time taken for SSL/TLS handshakes for each request. Inefficient SSL/TLS negotiations or failure to reuse connections can slow down the secure transmission, thereby impacting overall load times.
Recognizing these issues within HAR files provides a solid foundation for improving web performance. While HAR files expose these problems, addressing them requires a combination of frontend optimizations, server configuration adjustments, and sometimes architectural changes. Employing HAR file analyses in each performance review cycle ensures ongoing enhancements and efficient troubleshooting of web applications.
Using HAR Files with LoadForge
LoadForge offers a dynamic way to utilize HAR (HTTP Archive) files for replicating and testing your web application under real-world load scenarios. By converting HAR files into LoadForge tests, you can simulate traffic precisely as it occurred in your captured session, allowing you to enhance your website's performance and scalability under high traffic volumes. This section will guide you through the process of using HAR files with LoadForge.
Step 1: Capture and Prepare Your HAR File
Ensure that you have followed the steps in previous sections to accurately record your browser session in Chrome and save the HAR file. This file should represent the typical user interactions that you want to test under load.
Step 2: Import the HAR File into LoadForge
LoadForge provides a straightforward method to import your HAR file and create a test script:
- Log in to your LoadForge account and navigate to the Scripts section.
- Click on Create Script and select the Import HAR File option.
- Upload your HAR file. LoadForge will automatically generate a test script based on the requests captured in the HAR file.
Step 3: Customize Your Load Test
After generating the script, you might want to customize it to better suit your testing objectives:
- Modify User Behavior: Adjust the frequencies of different requests or add delays between actions to more accurately mimic user behavior.
- Scale the Load: Decide on the number of virtual users and duration for your test, scaling it up or down based on your requirements.
Here's an example of tweaking a generated script:
- delay: 3  # Adds a 3 second delay between actions
- post:
    url: "/api/login"
    data:
      username: "user1"
      password: "password1"
    expect:
      status: 200  # Ensures that the login is successful
Step 4: Run Your Load Test
Once your script is ready and configured according to your load testing goals, it's time to execute:
- Go to the Tests section and click Create Test.
- Select your script, define the number of users, and set the test duration.
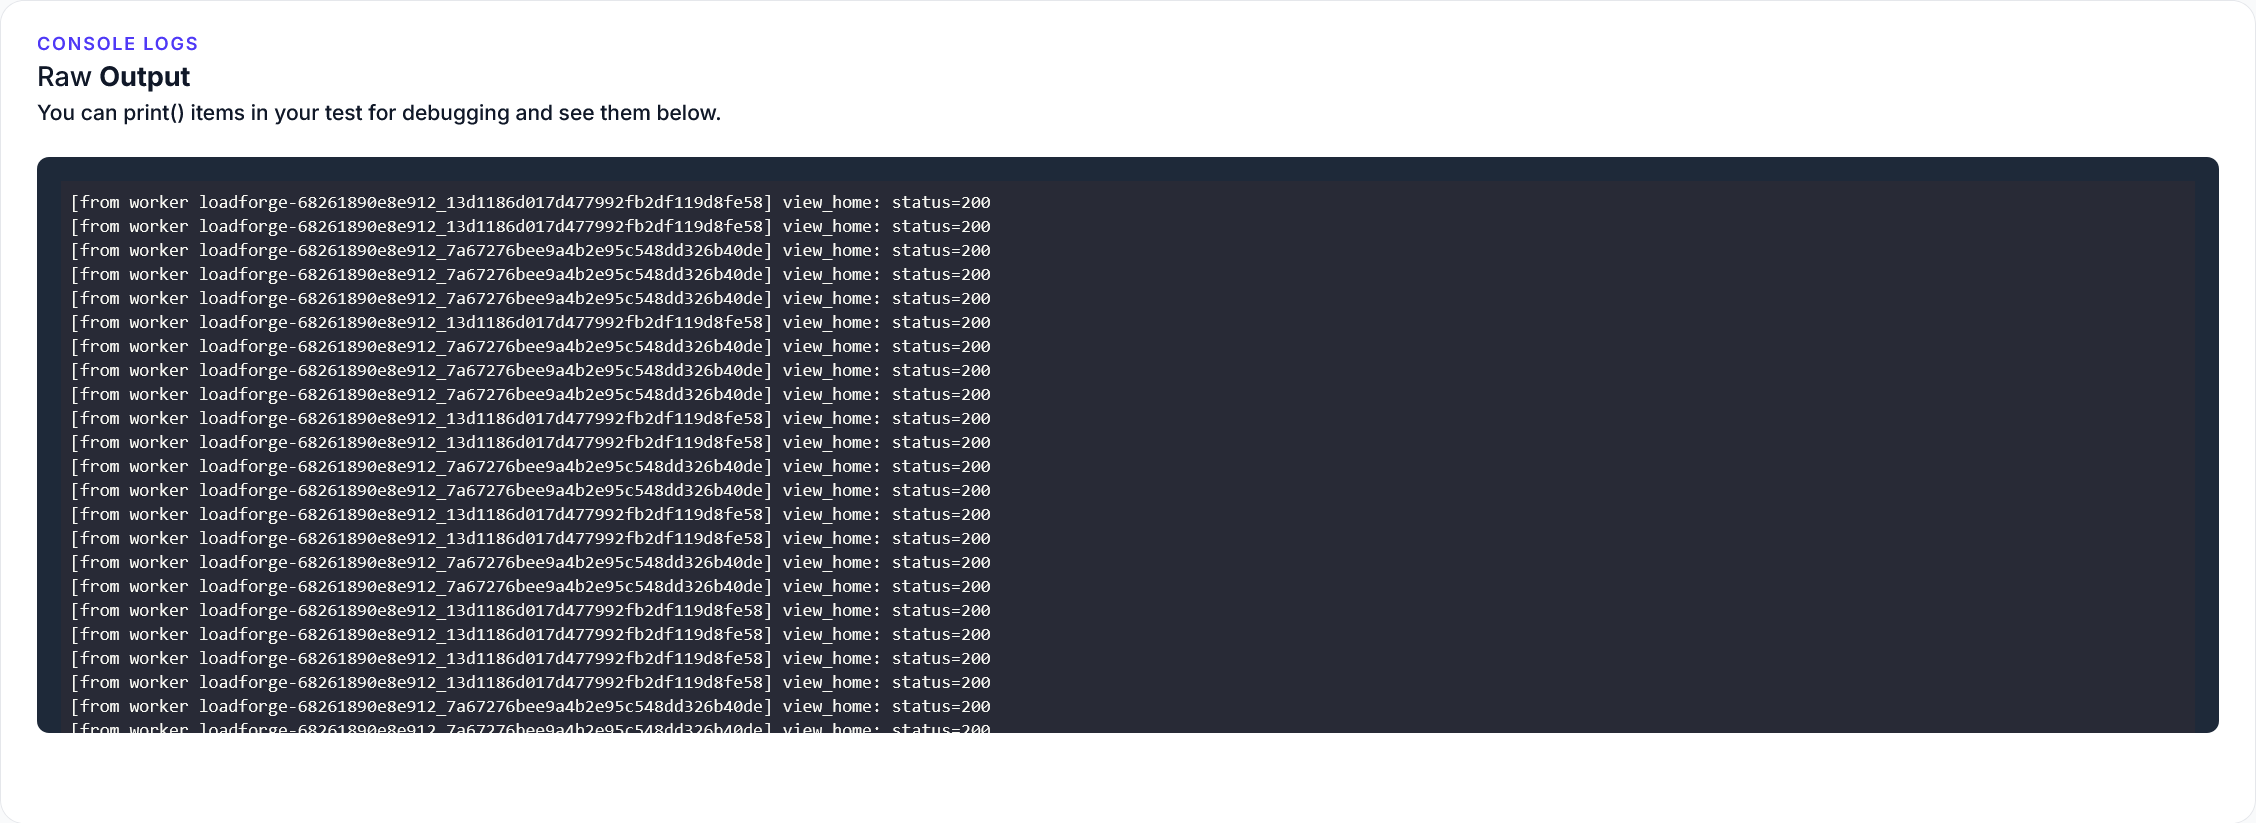
- Start the test and monitor the performance data in real-time through LoadForge's dashboard.
Step 5: Analyze the Results
Post-test, analyze the performance metrics collected by LoadForge. Look for:
- Response times
- Success rates of requests
- Server resource utilization
These insights will help you identify bottlenecks and areas for performance enhancement.
Step 6: Iterate and Optimize
Based on the findings, you might need to adjust your web application or the load test itself:
- Optimize backend systems to handle peak loads.
- Tweak the LoadForge script to better simulate user behavior.
- Re-run the test to measure improvements and refine further as needed.
Benefits of Using LoadForge with HAR Files
Using HAR files with LoadForge not only helps replicate accurate user scenarios but also enhances your testing strategy by:
- Simulating Real-World Traffic: Mimics actual user interactions captured from your production environment.
- Identifying Performance Bottlenecks: Provides insights into specific endpoints or resources that degrade under stress.
- Improving Scalability: Tests and optimizes your application's capacity to handle large volumes of concurrent users.
By integrating HAR files into your LoadForge testing strategy, you can significantly boost your site's performance and reliability, ensuring it stands up to real-world pressures effortlessly.