We're excited to announce a powerful new feature for LoadForge users: comprehensive debug logging for test runs. This highly requested capability makes it easier than ever to troubleshoot, validate, and understand what's happening during your load tests.
What's New
With this update, you can now use simple Python print() statements in your Locustfiles to log debug information that will be automatically collected and displayed in your test results. This provides valuable insights into the behavior of your test scripts and the application under test.
How It Works
Using the debug logging feature is straightforward:
- Add
print()statements to your Locustfile wherever you need to log information - Run your test as usual
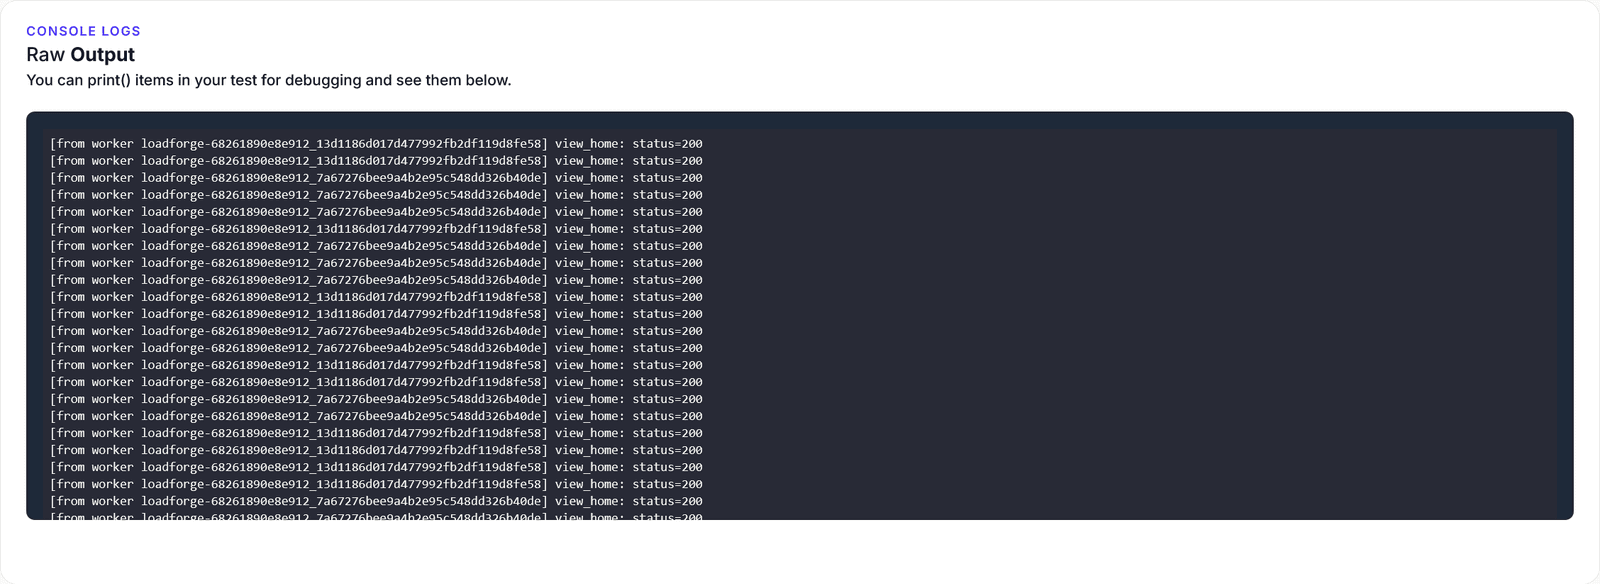
- View the collected logs in the "Errors & Logs" section of your test results
Here's a simple example:
from locust import HttpUser, task, between

class QuickstartUser(HttpUser):
    wait_time = between(1, 5)

    @task
    def view_home(self):
        r = self.client.get("/")
        print(f"view_home: status={r.status_code}")
This will log the status code of each request to your home page, making it easy to verify that requests are succeeding.
Key Benefits
- Simplified Debugging: Quickly identify issues in your test scripts or application behavior
- Request Validation: Verify that API calls are returning expected data
- Flow Tracking: Monitor the sequence of operations performed by virtual users
- Performance Insights: Log response times or other metrics to identify bottlenecks
- Aggregated Results: Logs from all workers are collected and displayed in a single view
Use Cases
Tracking API Responses
Log detailed information about API responses to verify data integrity:
with self.client.get("/api/products", catch_response=True) as response:
    try:
        data = response.json()
        print(f"Products API: status={response.status_code}, count={len(data['products'])}")

        if len(data['products']) == 0:
            print("WARNING: Products API returned empty list")
            response.failure("Empty product list")
    except json.JSONDecodeError:
        print(f"ERROR: Invalid JSON response: {response.text[:100]}...")
        response.failure("Invalid JSON")
Monitoring Performance
Selectively log information about slow requests:
r = self.client.get(f"/products?category={category_id}")

# Only log slow responses
if r.elapsed.total_seconds() > 1.0:
    print(f"SLOW REQUEST: /products?category={category_id} took {r.elapsed.total_seconds():.2f}s")
Tracking User Flows
Create structured logs to track complex user journeys:
def log(self, message):
    """Custom logging with session context"""
    print(f"[{self.session_id}] {message}")

@task
def multi_step_process(self):
    self.log("Starting multi-step process")
    # ... perform steps ...
    self.log("Process completed")
Getting Started
Ready to add debug logging to your tests? Simply add print() statements to your existing Locustfiles and run your tests as usual. The logs will automatically appear in your test results, making it easier than ever to understand what's happening during your load tests.
For more advanced logging patterns and best practices, check out our debug logging documentation.