Introduction
Website performance is critical for success. A fast-loading site keeps users engaged, drives higher conversion rates, and even improves search engine rankings. In fact, over half of visitors will abandon a website if it takes longer than 3 seconds to load, and even a one-second delay can reduce conversions by around 7%. Speedy sites create a smoother user experience, leading to higher user satisfaction and better customer retention. On the SEO front, Google uses page speed (and related Core Web Vitals) as a ranking factor – faster sites are rewarded with better visibility. For businesses, this means performance optimizations can directly translate into more revenue and improved retention.
One key strategy to ensure great performance is load testing. Load testing goes beyond a simple “does the site stay up?” check. It evaluates how your site behaves under stress: response times, error rates, and consistency during high traffic. Rather than only seeking a pass/fail result, you want to see that pages still load quickly when 50, 100, or 1000 users hit your site simultaneously. Consistent response times under load ensure every customer enjoys a fast experience, not just the first few. By load testing your WordPress site, you can identify performance bottlenecks (like slow database queries or heavy plugins) before real users encounter them. This guide will walk you through a practical approach to load testing a WordPress site hosted on Rapyd Cloud using the LoadForge platform – from environment setup and writing test scripts to running tests and interpreting the results.
Why Use LoadForge
LoadForge is a modern load testing platform that makes it easy to simulate traffic and monitor performance over time. It offers several features that are particularly useful for agencies and WordPress site owners:
- Scheduled Load Testing: You can set up tests to run automatically on a schedule (e.g. weekly) to continually verify your site’s performance. This helps catch any regressions early – for example, if a new plugin update slowed down your site, a scheduled test would highlight the change.
- Weekly Performance Checks & Continuous Tracking: LoadForge provides the ability to track performance metrics over time. By running regular tests, you can maintain your performance targets and see trends. This is great for maintaining SLAs or performance budgets. The platform even supports continuous testing (integration into CI/CD) to ensure each deployment meets your speed criteria.
- Real User Monitoring (RUM): In addition to synthetic load tests, LoadForge can incorporate real user monitoring. That means you can measure actual users’ experiences (like real page load times in browsers, Core Web Vitals, etc.) alongside your load tests. By combining RUM with load testing, you get a full picture: lab-style stress test results and field data from real visitors.
- Core Web Vitals and SEO Benefits: By consistently using LoadForge to keep your site fast, you’ll naturally improve metrics like Largest Contentful Paint (LCP), First Input Delay (FID), and overall server response times. Better performance improves your Core Web Vitals, which in turn can boost your search engine rankings and organic traffic. LoadForge essentially helps you enforce a performance-first discipline that benefits SEO.
- Ease of Use and Scalability: LoadForge supports writing tests in Python (via Locust scripts) or using built-in test wizards. You can simulate anything from a handful of users to millions of virtual users at scale, all from a cloud-based interface. It also offers features like a graphical test builder and integrations (e.g. Jira integration for automated issue creation if tests fail). For agencies managing multiple sites, LoadForge’s cloud-based approach means you don’t have to maintain your own load testing infrastructure – it can generate load from multiple global locations and present results in one dashboard.
Overall, LoadForge helps you not only stress test your site’s capacity but also ensure quality of response under load. Next, we’ll look at Rapyd Cloud – the high-performance hosting environment for our WordPress site – and why it’s an ideal partner in this testing scenario.
Overview of Rapyd Cloud
Rapyd Cloud is a managed WordPress hosting platform designed specifically for high-performance and dynamic sites (think busy blogs, WooCommerce stores, membership platforms, etc.). Unlike generic hosting, Rapyd Cloud’s infrastructure is tuned to squeeze maximum speed out of WordPress:
- LiteSpeed Enterprise Server: At the core of Rapyd Cloud is LiteSpeed Enterprise, a web server known for its efficiency and speed. LiteSpeed can handle concurrent users better than traditional Apache or Nginx setups, and it has built-in server-level caching optimized for WordPress sites. This means WordPress pages (especially repeat visits or cached pages) can be served extremely fast from memory, reducing the load on PHP and the database. The result is lower initial page load times and the ability to handle high traffic without slowing down.
- Dynamic Scaling: Rapyd Cloud doesn’t lock you into fixed server resources. The platform can scale resources in real-time based on your site’s needs. If you experience a sudden spike in traffic (say your post went viral or you have a holiday sale rush), Rapyd Cloud automatically adjusts to handle the load without crashing or requiring an emergency upgrade. This dynamic scaling ensures your site stays up and responsive during traffic bursts, which is perfect for load testing scenarios – you can push the site to high user levels and observe how the infrastructure adapts.
- Advanced Caching and Optimization: Rapyd Cloud includes multiple layers of caching and performance tuning out-of-the-box. For example, it integrates with Redis object caching to store frequent database query results in memory. This greatly accelerates dynamic WordPress sites (like WooCommerce stores or forums) by avoiding hitting the database for every request. In fact, Rapyd Cloud pairs Redis with their own advanced caching technology to optimize how content is served. The hosting also offers a built-in CDN (Content Delivery Network) called Rapyd Cloud CDN, which can serve your static assets (images, CSS, JS) and even full pages to global visitors from edge locations, reducing latency.
- WordPress-Specific Tuning: Because Rapyd Cloud focuses solely on WordPress, it comes with configurations tailored to common WordPress use-cases. For instance, there are WooCommerce-specific optimizations – handling cart data, sessions, and even caching parts of product pages while respecting dynamic content. Rapyd Cloud will intelligently invalidate caches when needed (for example, automatically purging cached pages when a product stock changes or when an update is made). For membership or LMS sites, it employs role-based caching so that pages show correctly for logged-in users yet still cache what can be cached. All these tweaks mean your WordPress site can run faster without you manually adding dozens of optimization plugins.
- Security and Reliability: Along with performance, Rapyd Cloud has a strong security architecture (WAF tuned for WordPress, malware scanning, virtual patching of vulnerable plugins, etc.). While security isn’t the focus of this guide, it’s good to know the hosting environment is robust – a crashing site from a load test might sometimes be due to security limits or firewalls, but Rapyd Cloud is built to handle legitimate high traffic safely.
In short, Rapyd Cloud provides a fast, scalable, and WordPress-optimized environment. This makes it an excellent foundation for load testing: it can withstand heavy load, and it includes performance boosters (like caching) that you’ll want to have enabled during tests to simulate real-world conditions. Next, let’s go through how to set up a WordPress site on Rapyd Cloud and prepare it for testing.
Setting Up WordPress on Rapyd Cloud
Setting up a WordPress site on Rapyd Cloud is straightforward. In this section, we’ll outline the steps to deploy WordPress (and optionally WooCommerce) on Rapyd Cloud and ensure the environment is configured for optimal performance before we run any load tests.
Steps to deploy and configure WordPress on Rapyd Cloud:
- Sign Up and Choose a Plan: If you’re new to Rapyd Cloud, start by signing up on the Rapyd Cloud website and selecting a hosting plan that fits your needs. Rapyd Cloud offers various tiers (with different resource limits and scaling capabilities). For load testing purposes, ensure your plan/environment has enough headroom for the virtual users you plan to simulate.
- Deploy a New WordPress Environment: Once you have an account, log in to the Rapyd Cloud dashboard. Create a new environment (site) by following the guided setup. You’ll typically provide a site name and choose a data center location. Rapyd Cloud will then automatically provision a server and install WordPress for you. This includes setting up the LiteSpeed server stack, PHP, database, etc. After a short initialization, you’ll have a fresh WordPress site running on a temporary domain (often something like
yoursitename.rapyd.cloud). - Access WordPress and Complete Setup: Rapyd Cloud will supply you with the WordPress admin login credentials (either you set these during setup or they provide a random password). Log into your new WordPress site’s WP Admin dashboard. Here you can perform typical initial setup tasks: for example, set your site title, adjust permalink settings to “Pretty Permalinks” (e.g.
/%postname%/for clean URLs), and remove any placeholder content you don’t need. - Install WooCommerce (Optional): If you plan to test an e-commerce scenario, install the WooCommerce plugin. In WP Admin, go to Plugins -> Add New, search for WooCommerce, install and activate it. Follow WooCommerce’s setup wizard to create essential pages (Shop, Cart, Checkout) and add a sample product or two. WooCommerce even provides sample data you can import (e.g., via the WooCommerce plugin’s settings or using the WooCommerce REST API) to populate your store with products for testing.
- Performance Configuration – Caching: Rapyd Cloud’s platform uses LiteSpeed, so it’s highly recommended to use the LiteSpeed Cache plugin (LSCache) for WordPress. In many cases, Rapyd Cloud might pre-install it for you. If not, install and activate LiteSpeed Cache from the plugin repository. This plugin will interface with the server’s cache to enable full-page caching for guests and optimization features. In the LiteSpeed Cache settings, you can enable the cache (if not already), and configure other optimizations (minification, etc., though for initial load testing, basic caching is most important). For WooCommerce, LSCache is smart enough to exclude cart/checkout pages from cache and handle Woo-specific cache varies, so it’s a good fit.
- Performance Configuration – Object Cache: Rapyd Cloud supports Redis caching at the server level, which can greatly speed up database operations. To utilize this, install a plugin like Redis Object Cache. Once activated, you can enable the object cache in the plugin settings – it should connect to the Redis service available on Rapyd Cloud and start caching query results. This is especially beneficial for WooCommerce or any logged-in user activity, as it reduces database load under heavy usage.
- Database and Other Optimizations: Ensure your WordPress site is running the latest PHP version (Rapyd Cloud supports PHP 8+ which has performance improvements). Basic database optimizations are usually handled by the platform, but you can double-check things like turning off WP_DEBUG in your
wp-config.php(debug mode can slow down responses). If your site has a lot of content, consider using a plugin like WP-Optimize to clean up revisions and transient options. However, on a brand new site this isn’t critical. - Final Check – High-Performance Features: Rapyd Cloud provides other features like their global CDN and image optimization. It’s worth enabling the CDN (often just a toggle in the Rapyd dashboard to use the Rapyd Cloud CDN for your site) so that static assets are served from edge locations – this can improve test realism if your load test agents are distributed globally. Also, ensure any performance features in Rapyd’s dashboard (like Relay caching or special WooCommerce modes) are enabled if available. The goal is to mirror a real production-ready high-performance setup.
- Staging vs Production: If this site is an existing production site, consider creating a staging environment on Rapyd Cloud for testing. Rapyd Cloud allows adding staging sites or temporary domains. It’s best practice to run load tests against a non-production clone of your site to avoid disrupting real users. Ensure the staging clone has the same configuration (plugins, data, caching settings) so that test results are accurate. If you must test on production, do so in off-peak hours and with caution.
By the end of these steps, you have a WordPress site (with optional WooCommerce) running on Rapyd Cloud and tuned for performance (caching in place, etc.). Now you’re ready to create load test scripts that simulate visitors on this site. We’ll use Locust for writing these test scenarios, which LoadForge will execute for us.
Writing a Locust Test for WordPress
To effectively load test our WordPress site, we need to simulate realistic user behavior. We’ll create two load test scripts using Locust (a Python-based load testing framework that LoadForge supports):
- A generic WordPress browsing test – simulating visitors who browse pages and perhaps log in.
- A WooCommerce store test – simulating an e-commerce flow with product views, adding to cart, and checking out.
Each script (called a locustfile, typically named locustfile.py) defines the actions that virtual users will perform on your site. Let’s go through both scripts and explain their components.
Locustfile for a Basic WordPress Site (Browsing Simulation)
In this first locustfile, we simulate users visiting a WordPress blog or informational site. They will hit the homepage, load some blog posts, and even attempt a login (to simulate how the site behaves for an authenticated request, such as accessing the WP login page).
from locust import HttpUser, task, between

class WordPressUser(HttpUser):
    # Wait time between tasks to mimic real user think time
    wait_time = between(1, 5)  # each user waits 1 to 5 seconds between actions

    host = "https://yourwordpresssite.com"  # Replace with your Rapyd Cloud site URL or domain

    @task(3)
    def view_homepage(self):
        """Simulate viewing the homepage"""
        self.client.get("/")

    @task(2)
    def view_blog_post(self):
        """Simulate reading a blog post"""
        # Replace the URL with a real post URL from your site
        self.client.get("/2023/02/01/sample-blog-post", name="/blog-post")

    @task(1)
    def attempt_login(self):
        """Simulate visiting the login page (POST login form)"""
        self.client.post("/wp-login.php", data={
            "log": "testuser",      # a test username
            "pwd": "testpassword"   # a test password
        }, name="/wp-login.php")
In the code above, we define a user class WordPressUser that extends HttpUser (provided by Locust). Let’s break down what each part does:
-
wait_time = between(1, 5): This makes each simulated user pause between 1 to 5 seconds after completing a task before starting the next one. It introduces a realistic delay (think of it as the time a real person spends reading a page or thinking before clicking the next link). This prevents the test from hammering the server nonstop and more closely mimics real traffic patterns. -
host: We set the target host to our site’s base URL (replace"yourwordpresssite.com"with your actual domain or the Rapyd Cloud preview domain). This way we don’t have to specify the full URL in every request. -
Tasks with
@taskdecorator: Each method marked with@taskis an action a user can perform. The number in parentheses (e.g.@task(3)) is the weight – higher weight means the task occurs more frequently relative to others.view_homepage(@task(3)): This task callsself.client.get("/"), an HTTP GET request to the homepage. We weighted it 3, meaning it’s the most common action – our simulated traffic will hit the homepage frequently (as often happens in real life, the homepage or landing page is a common entry).view_blog_post(@task(2)): This represents a user clicking through to read a blog post or article. We used a sample URL"/2023/02/01/sample-blog-post"which assumes a permalink structure by date; you should replace that with an actual path from your site (for example,"/hello-world"or"/blog/my-article"depending on your setup). Thename="/blog-post"parameter gives a label to this request in reports (so all blog post requests aggregate under one name rather than showing the full URL – useful if you have multiple posts; it lets you see overall performance of “blog post page” loads).attempt_login(@task(1)): This sends a POST request to the WordPress login endpoint with some credentials. We weight this lowest (1) because not every user will log in; it’s a rarer action. Thedatadictionary includes form fieldslog(username) andpwd(password). In a real test, you could create a test user account (e.g.,testuser/testpassword) on your site beforehand so that the login attempt can actually authenticate. Even if the credentials are wrong, this still exercises the server’s login process (hitting the database to check credentials, etc.). Thenamehere labels all such requests as "/wp-login.php" in reports.
Together, these tasks simulate a mix of user activities. Roughly, for every 6 actions (3+2+1 weights), 3 will be homepage views, 2 will be blog post views, and 1 will be a login attempt. This ratio can be adjusted to match your expected user behavior (e.g., if logins are extremely rare or if you want to simulate search or other actions, you can add more tasks). You can also add tasks for things like browsing category pages or performing a site search to expand the test.
Locustfile for a WooCommerce Store (E-commerce Flow Simulation)
For WordPress sites with WooCommerce, it’s important to test the shopping flow – product browsing, adding items to cart, and the checkout process. WooCommerce introduces dynamic content and heavier database usage, especially during checkout, so load testing these paths is crucial for an online store.
Below is a Locust file that simulates a basic WooCommerce user journey:
from locust import HttpUser, task, between
import random

class WooCommerceUser(HttpUser):
    wait_time = between(1, 5)  # users wait between actions

    host = "https://yourwordpressstore.com"  # Replace with your store's URL

    @task(4)
    def view_product_page(self):
        """Browse random product pages"""
        # Assume product IDs 1-10 exist for testing; adjust based on your data
        product_id = random.randint(1, 10)
        self.client.get(f"/product/{product_id}", name="/product")

    @task(2)
    def add_product_to_cart(self):
        """Add a product to the cart"""
        # Simulate adding product ID 1 to cart (replace ID as needed)
        self.client.get("/?add-to-cart=1", name="/add-to-cart")
        # After adding, maybe view the cart page
        self.client.get("/cart/", name="/cart")

    @task(1)
    def proceed_to_checkout(self):
        """Proceed to checkout page (after cart)"""
        self.client.get("/checkout/", name="/checkout")
        # Optionally, simulate submitting the checkout form (placing order)
        # For simplicity, we'll skip form submission or use a minimal placeholder:
        self.client.post("/checkout/", data={"woocommerce_checkout": "1"}, name="/checkout_submit")
Let’s unpack the WooCommerce test script:
- We import
randombecause we want to vary which product pages users view. In a real store, users will look at different products, not the same one every time. WooCommerceUserclass: similar to before, each user will wait 1-5 seconds between actions and target our store’s URL.view_product_page(@task(4)): This task simulates a user browsing products. We pick a random product ID between 1 and 10 and send a GET request to"/product/{id}". This assumes your site’s product pages are accessible via/product/<id>or that the ID in the URL works (if your permalinks use product slugs, you might need a list of known product slugs instead of numeric IDs). Thename="/product"groups all product page requests together in reports. We weight this task highest (4) because browsing products is the most frequent action in an e-commerce scenario.add_product_to_cart(@task(2)): This task simulates adding an item to the cart. It does two things: first, it sends a GET request to"/?add-to-cart=1", which is a WooCommerce endpoint to add product ID 1 to the cart. (In WooCommerce, visiting a URL with?add-to-cart=<id>will add that product and redirect to the cart page. We use product ID 1 as an example; you can use a random ID or a specific popular product’s ID here. Alternatively, one could do a POST to the/cart/form, but the GET query parameter is a simpler shortcut.) After adding, we then explicitly GET the cart page("/cart/")to simulate the user viewing their cart. We name these requests"/add-to-cart"and"/cart"respectively in the stats.proceed_to_checkout(@task(1)): This represents the user proceeding to the checkout page. It first GETs the"/checkout/"page, which on a WooCommerce site will display the checkout form. We name it"/checkout"for tracking. We then have an optional step to POST to the checkout URL with minimal data, labeled as"/checkout_submit". In a real scenario, posting the checkout form would include all the billing details, payment method, etc., and would create an order. For our test, we simplify by sending a placeholder field (woocommerce_checkout:1) to mimic a form submission. This likely won’t complete an order successfully (since required fields aren’t included), but it does hit the server’s checkout processing logic lightly. Depending on how deep you want to simulate, you could create a test payment method (like “Cash on Delivery”) and fill in all form fields to fully execute an order. That would give the most realistic result (including database writes for orders), but it requires more scripting to handle nonces and form tokens. For initial load testing, just reaching the checkout page and maybe a lightweight POST is sufficient to simulate the load.
We weighted checkout lowest (1) because only a subset of users who browse products will actually initiate checkout. By having weights 4 (browse), 2 (add to cart), 1 (checkout), we ensure the majority of activity is just viewing products, some fraction adds items, and an even smaller fraction goes to checkout – roughly reflecting a funnel where not everyone who browses becomes a buyer.
Note: In Locust, tasks are executed in a loop for each user, in random order weighted by those numbers. This means some virtual users might do a checkout task before adding to cart (which isn’t perfectly logical). Over many users, the weighted distribution still yields a realistic overall pattern, but it’s not sequential per user. If you need a strictly sequential flow (browse -> add -> checkout in order), you can code a single task method that calls these steps in sequence, or use task sets. However, for simplicity, the above approach is usually fine to stress the system with the correct proportions of requests. Just be aware that not every simulated “user” corresponds to a coherent session when using separate weighted tasks. (Each Locust user will keep a session cookie though, so if a user adds to cart then views cart, it’s the same session and the item will be in their cart. The randomness comes in whether a particular virtual user hits checkout without having done an add – they might see an empty checkout page. This is okay for load testing since even an empty checkout page still loads the same infrastructure, but if desired you can refine the logic.)
After writing your locustfiles, save them (e.g. as locustfile_wp.py and locustfile_woo.py). These scripts will be uploaded to LoadForge in the next step. You can also test them locally using the Locust tool (running locust -f locustfile_wp.py and opening the web UI at http://localhost:8089 to run a quick smoke test) to ensure they work properly before using LoadForge’s infrastructure.
Running Load Tests with LoadForge
With our Locust scripts ready and our WordPress site configured, it’s time to run the load tests on LoadForge. LoadForge will handle executing these tests from the cloud, simulating the number of users we specify, and gather detailed metrics.
Setting up a test in LoadForge (via the web UI):
-
Log in to LoadForge: Go to the LoadForge dashboard and sign in to your account. If you don’t have an account, you’ll need to register and possibly select a plan that supports the number of virtual users you intend to run.
-
Upload your Locust script: In the LoadForge dashboard, find the section for Scripts (or it might be under a “Test Scripts” menu). Click “New Script” (or an upload button) and upload the locustfile you wrote. You can give it a recognizable name (e.g., “WordPress Blog Test” or “WooCommerce Checkout Test”). LoadForge will store this script and use it as the basis for running users. (We will include screenshots of this interface in the final post for clarity.)
-
Create a New Test Configuration: Navigate to the Tests section and click “New Test.” Here, you’ll configure the parameters of your load test:
- Select Script: Choose the Locust script you uploaded from a dropdown.
- Number of Virtual Users: Enter how many concurrent users you want to simulate. For example, 200, 500, 1000 – depending on what load you want to test. If unsure, start with a smaller number and increase in later runs.
- Spawn Rate: This is how fast LoadForge will ramp up users. For instance, a spawn rate of 10 means 10 new users are added per second until it reaches the total. A ramp-up avoids hitting the server with all users at once; it’s often realistic to ramp traffic.
- Test Duration: Set how long the test should run at full load (not counting ramp-up). You might do a 5 or 10 minute test for a quick check, or longer (30-60 minutes) for soak testing. Ensure the duration is enough to gather stable metrics.
- Geographical Locations: LoadForge allows you to choose data center locations for the load generators. For example, you might run the test from North America and Europe simultaneously if your audience is global. Choose the locations that match your user base (or use the nearest location to your server for a “best-case” performance scenario). For Rapyd Cloud hosting, if your server is in a specific region, you might want load generators in that region to minimize artificial latency, unless you specifically want to test cross-region latencies.
- Load Pattern: Some tools allow different patterns (steady, ramp, spike, etc.). In LoadForge’s interface, this might be simplified to just ramping up to a steady state. Configure as needed (for example, a common pattern: ramp up to N users over X minutes, hold for Y minutes).
- Scheduling (Optional): If you want this test to run regularly, look for a scheduling option. LoadForge lets you schedule tests to run automatically at set intervals (e.g., every week at midnight Sunday). Enabling this means LoadForge will run the test and perhaps email you the results or alerts if metrics fall outside expectations. This is great for continuous performance monitoring.
-
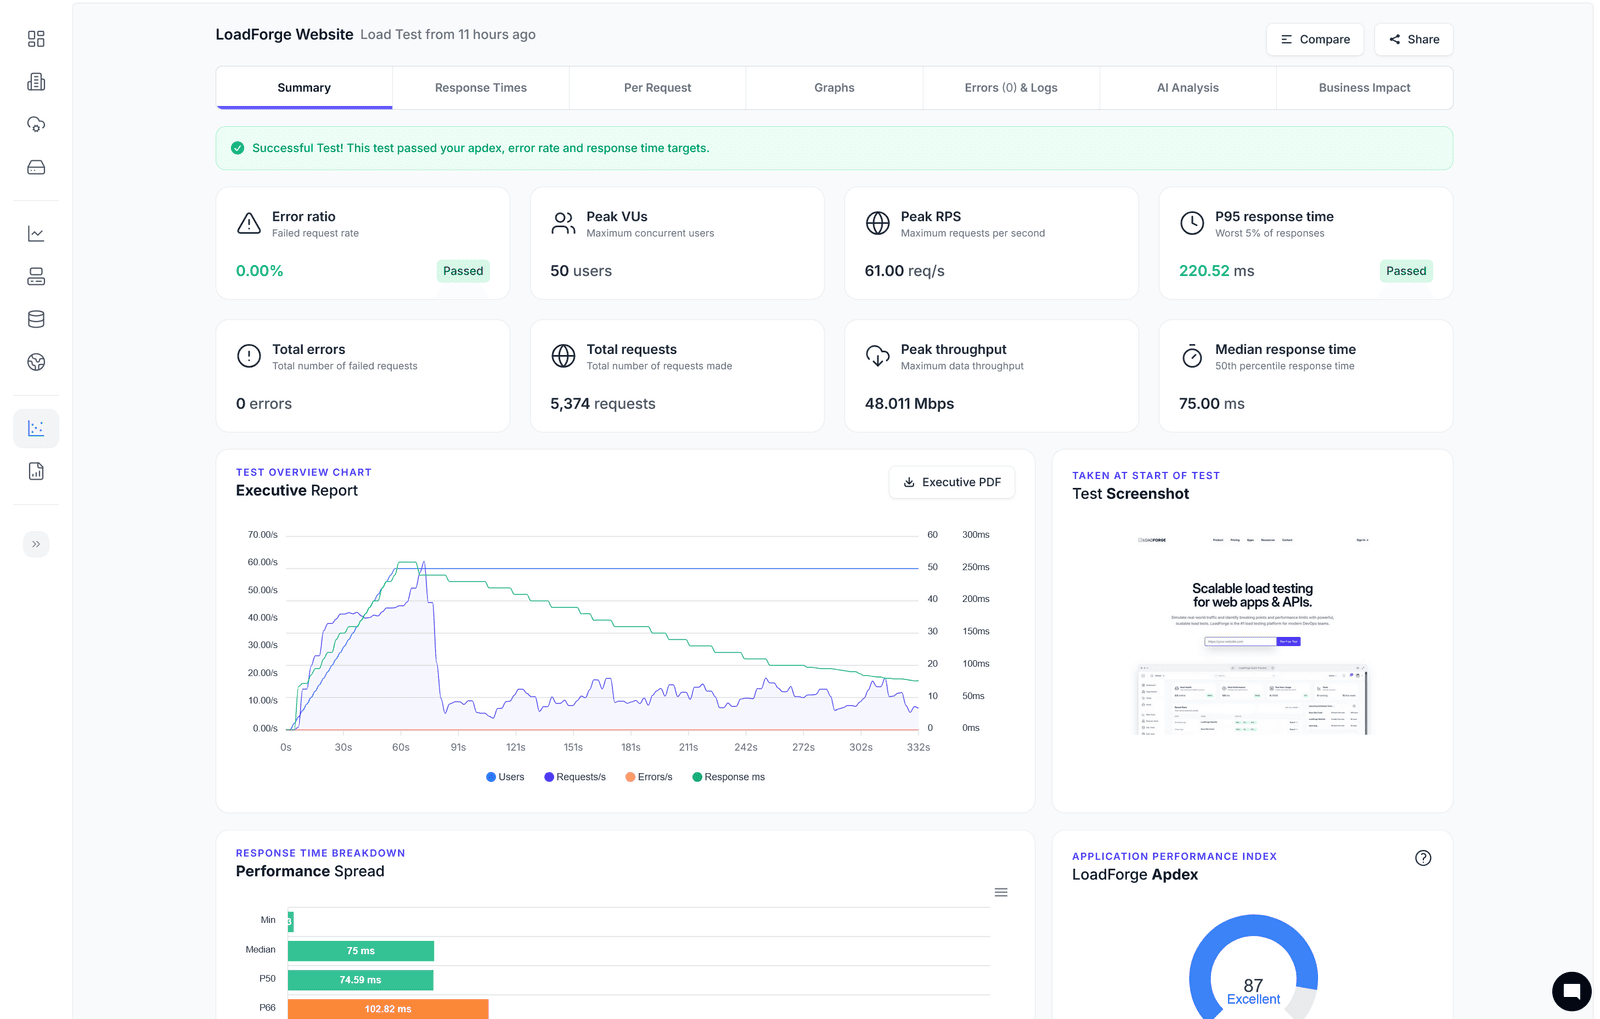
Execute the Test: Double-check your settings, then hit the “Run Test” button. LoadForge will start provisioning the test. You’ll usually see a live dashboard once the test begins. This dashboard will display real-time metrics like number of active users, requests per second, current response times, and any errors. (Screenshots of the running test dashboard will be added later.) During the test, keep an eye on the graphs – for example, watch how response times change as user count increases. LoadForge might also show a throughput graph (requests/sec) and error count in real time.
-
Monitoring and Logs: While the test is running, you can often drill down into details. LoadForge may let you see per-endpoint performance (thanks to the
namewe used in tasks, e.g., you might see separate stats for “/” vs “/blog-post” vs “/checkout”). If any errors occur (HTTP 5xx errors or timeouts), those will be logged. You can often click to see error messages or which requests failed. This is useful to identify if a particular page is crashing under load. -
Test Completion: After the test duration has elapsed (and all users have finished their tasks), LoadForge will stop the test and compile a report. You’ll typically get a summary of key results (average response time, percentiles, total requests, errors, etc.). Don’t forget to stop or terminate the test if needed (most platforms auto-stop when time is up, but ensure it’s not running indefinitely to avoid unnecessary load on your site).
If you plan to run tests on a schedule, you can save the test configuration. LoadForge might have a “Save” or “Schedule” option where you set the recurrence. For now, run the test manually and gather the results. In the next section, we’ll discuss how to interpret the performance data you get.
(If this is your first time, it’s a good idea to run a smaller test (say 10-50 users) initially just to confirm everything works – the scripts are hitting the right URLs, no obvious errors. Once that passes, you can ramp up to higher loads.)
Interpreting Results
After your LoadForge test completes, you’ll have a wealth of data. Knowing how to read and interpret this data is key to turning numbers into actionable insights. Let’s go over the critical metrics and how to relate them to your performance goals and business outcomes:
-
Response Times (Latency): This is the time it takes for your server to respond to requests. Look at the average response time, but even more importantly the percentiles:
- Median (50th percentile): Half of the requests were faster than this value. This can represent a typical user’s experience.
- 95th and 99th Percentiles: These values show the slowest 5% or 1% of requests. They are crucial because they indicate outlier slowness. For example, if the 95th percentile response time for the checkout page is 4 seconds, that means 1 in 20 checkout requests took at least 4 seconds – potentially a concern for user experience.
- Consistency: Ideally, your response times should stay relatively stable as load increases. If you notice that at low traffic the average page loads in 0.8s, but at peak load the average jumped to 5s, that indicates the server was straining and performance deteriorated. Consistent response times mean your site is handling the load within acceptable bounds.
-
Throughput (Requests per Second): This measures how many requests your site handled per second. It’s tied to user count and response time (higher concurrency or faster responses generally increase RPS). Monitor if throughput continues to scale with more users or if it plateaus or drops at some point – a drop could indicate the server reached a bottleneck (CPU, database, etc.) and can’t handle more throughput.
-
Error Rate: Check the number of failed requests or errors. Ideally this is 0. Any HTTP 5xx errors (500, 502, etc.) are red flags – they mean the server or application crashed or refused some requests under load. Even a small error rate (e.g. 0.5%) could mean some users would have seen broken pages or could not complete actions. Timeouts are another error type: if requests time out, users would perceive that as extremely slow or non-loading pages. For a successful test, you want zero errors at your target load. If errors occurred, identify what they were – for example, PHP fatal errors in logs, or database connection limits exceeded.
-
Resource Utilization (if monitored): LoadForge itself may not show server resource usage, but it’s wise to check your Rapyd Cloud dashboard for server metrics during the test. High CPU, memory, or database CPU could correlate with spikes in response time. If you hit a CPU ceiling at 100% during peak, that’s likely when response times shot up or errors started – indicating you need to optimize or increase resources.
-
Specific Endpoint Performance: Examine if certain pages were slower than others. Perhaps product pages were fine but the checkout had a much higher latency. Or the login requests took longer due to encryption/password hashing. Pinpointing the slowest transactions helps focus your optimization efforts on those critical paths.
To make sense of these results, it helps to have defined performance targets beforehand. For example, you might set a goal that even under 500 concurrent users, the homepage should load in under 2 seconds on average, and the checkout page in under 3 seconds, with 0 errors. How do your results stack up against such targets?
For clarity, here’s an example of performance targets vs. results:
| Metric (Under Load) | Target Goal | Test Result (Example) | Meets Target? |
|---|---|---|---|
| Home page average response time | < 2.0 s | 1.4 s | ✅ Yes |
| Home page 95th percentile | < 3.0 s | 2.8 s | ✅ Yes |
| Checkout page average response time | < 3.0 s | 4.2 s | ❌ No |
| Checkout page 95th percentile | < 4.0 s | 6.5 s | ❌ No |
| Error rate (all requests) | 0% (no errors) | 0.5% (50 errors of 10k requests) | ❌ No |
| Peak concurrent users handled | 500 users | 500 (reached) | ⚠️ Partial (with slowdowns) |
In the hypothetical table above, the test met the targets for the homepage, but the checkout page was slower than desired and some errors occurred. This tells us the checkout process is a bottleneck under load, potentially risking real customer orders if traffic spikes. We’d prioritize investigating and optimizing that.
Business implications: If your load test shows that at 300 concurrent users, the site remains fast and error-free, you can be confident in, say, handling a big marketing campaign or seasonal traffic. On the other hand, if you saw the site breaking down at 150 users, that’s a sign that current infrastructure or code won’t handle planned traffic – which could translate into lost sales (if an e-commerce site) or a damaged reputation. Remember the stats from our introduction: users won’t wait around for slow pages. A slow or crashing site during peak time can directly lead to lost revenue and lower customer trust. By interpreting the load test results in terms of user impact (e.g., “10% of our users would have experienced a 6+ second load time on checkout – likely causing many to abandon their carts”), you can make a strong case for the next steps to your team or client.
LoadForge’s reports often include visual graphs for response time distribution and perhaps comparisons to previous test runs. Use these to communicate trends. For instance, “We improved the 95th percentile load time from 6s to 3s after our optimizations – a huge win for user experience!”.
In summary, focus on speed, stability, and scalability in the results:
- Speed: Are pages loading within an acceptable time under load? (Define acceptable based on user expectations and prior analytics – e.g., if currently your site loads in 1s under no load, maybe 2-3s under heavy load is acceptable, but 10s is not).
- Stability: Did the site stay up with no errors? Any signs of crashing need addressing.
- Scalability: How much extra capacity do you have? If you tested 200 users and it was fine, consider also testing 300, 500, etc., until you start seeing breaking points. This helps plan for the future or high-burst scenarios.
Next, we’ll look at what to do if your results show areas for improvement – basically, how to optimize your WordPress site (or the hosting configuration) based on what the load tests revealed.
Optimizing Based on Results
A load test is only as useful as the action you take from it. If your WordPress site showed any signs of strain during the test – or if you simply want to improve response times further – it’s time to optimize. Here are some recommendations to boost WordPress and WooCommerce performance, guided by common issues observed in tests:
-
Review Caching Configuration: Caching is your best friend for WordPress performance. Ensure that page caching is working properly. For Rapyd Cloud users, the LiteSpeed Cache plugin + server should already handle this for guest users. Double-check that cache is enabled and that pages are indeed being cached (you can inspect response headers or use browser dev tools to see if a page was served from cache). If your load test showed gradually slowing responses, it might be that some pages weren’t cached. Adjust cache rules to include those pages if possible. For WooCommerce, sensitive pages (cart, checkout, my-account) won’t be cached (by design), so focus on other optimizations for those.
-
Implement a CDN for Static Assets: If not using Rapyd’s built-in CDN, consider enabling it or using a service like Cloudflare or AWS CloudFront in front of your site. A CDN will offload images, CSS, JS, and even cached HTML to edge servers, reducing the load on your origin. This is especially helpful if your load test agents were far from the server or if you plan for global traffic. It can also reduce server CPU usage since fewer requests hit the origin for static files.
-
Optimize the Database and Object Caching: Load testing often uncovers database bottlenecks (e.g., slow queries). Use the query insights from a plugin like Query Monitor or your host’s APM tools to identify queries that took long during the test. Perhaps a plugin is doing an expensive query on each page load. If so, see if there’s an update or alternative method. Make sure you have Redis object cache enabled (as covered in setup) – this helps repeated queries (like WooCommerce cart sessions, product lookups) to be served from memory. On Rapyd Cloud, the combination of Redis + their Relay cache means most repeated queries can be fetched quickly. If you didn’t have it on initially and saw high DB server usage, enabling it and re-testing could show major improvement.
-
Tune WooCommerce Settings: WooCommerce is powerful but can be heavy. Some tips specific to WooCommerce:
- Cart Fragments: WooCommerce uses an AJAX request to update the cart total in the menu (for some themes). This request (
/?wc-ajax=get_refreshed_fragments) can be a source of load, as it might run on every page load for logged-in users or when a cart changes. Consider disabling cart fragments if not needed (for example, if you don’t display the cart total in the header for every page). There are code snippets or plugins to disable cart fragment AJAX on pages where it’s not necessary (like only allow it on actual cart/checkout pages). - Session Management: Ensure session and transients are in memory (Rapyd Cloud does this via Redis). If not on a host like Rapyd, using a persistent object cache plugin to handle sessions (WooCommerce uses WP options table for sessions by default) will help.
- Reduce External Calls: During checkout, WooCommerce might call out to payment gateways or third-party APIs. In a load test (which might not fully simulate external API calls depending on your setup), you might not see this, but in production, those could slow things. Use webhooks or async processing for post-checkout actions if possible (for example, use WooCommerce’s built-in webhooks or a queue system for sending emails, rather than doing it inline during order placement).
- Optimize Product Queries: If you have a large product catalog, consider using a product lookup table (WooCommerce has features for this) or an external search/index service (like ElasticPress for search functionality). This prevents heavy LIKE queries on the wp_posts table under load.
- Cart Fragments: WooCommerce uses an AJAX request to update the cart total in the menu (for some themes). This request (
-
Lighten the Application Load: Audit your plugins and theme. If the load test reveals certain pages are slow, check what plugins or theme features run on those pages. For instance, if the home page is slow under load, is it pulling in a lot of widgets, external feeds, or heavy database queries (like listing 50 recent products)? Simplify wherever possible. Disable or remove plugins that aren’t essential. Every plugin adds some overhead, especially if they run queries or external calls on each request.
-
Increase Server Resources or Adjust PHP Workers: Rapyd Cloud will auto-scale to a point, but you might have limits based on plan. If your test consistently hits a ceiling (e.g., CPU pegged at 100% with 0 idle), you might need to scale up. On Rapyd Cloud, that could mean moving to the next plan tier or discussing with their support how to accommodate higher concurrency. If using LiteSpeed, ensure the number of PHP workers (concurrent PHP processes) is sufficient for the concurrency – Rapyd likely manages this, but if you have custom settings, too few workers can throttle performance.
-
Use Monitoring Tools in Parallel: Consider using APM (Application Performance Monitoring) tools like New Relic, Dynatrace, or the open-source XHProf/Blackfire during a load test. These can pinpoint slow functions or database calls in the WordPress code when under stress. For example, New Relic could show that a particular WooCommerce function or a specific SQL query was consuming 40% of the transaction time under load. Knowing that, you can target that function (maybe by caching its result or optimizing the code/query).
-
Front-end Optimizations for Real Users: While load testing focuses on server-side, don’t forget the front-end. Large images or unminified JS/CSS can slow down the real user experience (and indirectly, a bit of server load too via bandwidth). Use your load test findings (like if TTFB – time to first byte – is low but users still experience slowness, then the issue might be front-end). Optimize images (Rapyd Cloud’s image optimization can help), enable compression (Gzip/Brotli – LiteSpeed does Brotli by default), and minimize render-blocking resources. This will improve Core Web Vitals, which was one of our goals.
-
Implement Lazy Loading and Prefetching: For content-heavy pages, ensure images are lazy-loaded (WordPress does this natively now for images below the fold). Use
<link rel="preload">or<link rel="dns-prefetch">for key assets if needed. This doesn’t affect the server much, but improves perceived speed. -
Retest After Optimizations: After making changes, run your load tests again on LoadForge. This iterative process is how you gradually push your site’s capacity higher. For example, if after enabling Redis cache and removing one slow plugin, your 95th percentile checkout time dropped from 6s to 3s under 200 users, you know those changes worked. You might then try 300 users and see how it holds up. Keep an eye on trends – you want to see improvement with each change or know when you’ve hit the practical limit of your current infrastructure.
For Rapyd Cloud specifically, many optimizations are handled automatically (that’s their value proposition), but it’s still possible to misconfigure a WordPress site and hamper performance. By following the above tips, you ensure you’re not negating the platform’s optimizations. For instance, if you inadvertently had a page cache plugin that conflicts with LiteSpeed Cache, that could hurt performance – so stick to the caching solution that matches the server. Rapyd’s support and documentation can also be a resource; they might have specific recommendations if you’re load testing (such as temporarily disabling certain security features that might rate-limit requests during a test, if applicable).
Finally, consider a performance budgeting approach: set concrete goals (as we did in the table) and continuously monitor them. LoadForge’s weekly scheduled tests can send you alerts if performance deviates. Combine that with real user monitoring alerts (e.g., if real user LCP goes above 4s for a period of time, investigate). This proactive stance is what we call a performance-first mindset.
Conclusion
In today’s competitive digital environment, delivering a fast and reliable website experience is non-negotiable. By hosting your WordPress site on Rapyd Cloud, you’ve chosen a strong foundation optimized for speed and scalability. Layering on LoadForge for load testing and monitoring allows you to ensure that foundation remains solid even as you push the limits with heavy traffic.
Through this guide, we covered how to set up a WordPress (or WooCommerce) site on Rapyd Cloud, write realistic user simulations with Locust, and use LoadForge to execute those at scale. We emphasized not just passing a load test, but looking at the detailed metrics – response times, percentiles, error rates – to understand the user experience under stress. This data-driven approach links technical performance to real business outcomes: a second saved in load time could mean a higher conversion rate, and avoiding a crash at peak time could preserve your revenue and reputation.
To recap the benefits of ongoing performance testing:
- You catch performance regressions early, before they affect users or SEO rankings.
- You can validate that new features or marketing events won’t break the site, giving you and your stakeholders peace of mind.
- Over time, you build a performance baseline and can make intelligent decisions about scaling or optimization investments (for example, knowing you need to upgrade your plan or add a CDN before an anticipated traffic surge).
- You foster a performance-first mindset in your team – performance is treated as a core feature, not an afterthought. This mindset means developers consider the cost of every plugin or query, and content creators optimize images and media, all because the organization values speed.
As you move forward, continue the cycle of Test → Analyze → Optimize → Repeat. Tools like LoadForge make the testing part easy and even automated. Rapyd Cloud gives you a robust platform that can adapt as you optimize. The result of this synergy is a WordPress site that delights users with its responsiveness and resilience, even when everyone in the world seems to show up at your doorstep at once.
Remember, performance is a journey, not a destination. Keep monitoring, keep tweaking, and stay curious about new ways to improve. With the strategies outlined here, you’re well on your way to mastering load testing and ensuring your WordPress site is ready for whatever traffic comes its way. Happy testing and may your site remain lightning-fast!
Ready to get started? Explore LoadForge’s load testing platform to stress-test your website, or check out performance monitoring to track Core Web Vitals continuously. Want to automate tests in your deployment pipeline? See our GitHub integration.