Introduction
Achieving SOC2 compliance is crucial for organizations that handle sensitive customer data. SOC2, or Service Organization Control 2, is an auditing procedure that ensures service providers manage customer data with the highest standards of security, availability, processing integrity, confidentiality, and privacy. Compliance with SOC2 not only instills trust in customers but also helps avoid potential legal pitfalls and data breaches. Among the critical components of SOC2 compliance are robust monitoring and logging mechanisms.
Monitoring and logging play pivotal roles in achieving SOC2 certification. Effective logging allows organizations to track events, understand user behavior, and detect potential security incidents in real-time. Monitoring, on the other hand, provides insights into the application's health and performance, helping ensure that the system meets the stringent requirements for availability and integrity mandated by SOC2.
Introduction to FastAPI
FastAPI is a modern, high-performance web framework for building APIs with Python 3.7+ based on standard Python type hints. It is designed to be easy to use, fast, and secure, making it a popular choice for developing APIs that need to adhere to various compliance standards, including SOC2.
FastAPI’s design emphasizes:
- Ease of use: Intuitive and easy syntax.
- High performance: Built on Starlette for the web parts and Pydantic for the data parts.
- Robust security features: Includes OAuth2 support and other security features easy to integrate.
Given these attributes, FastAPI enables developers to build applications that are not only quick and reliable but also capable of meeting rigorous security and compliance requirements.
Importance of Monitoring and Logging
Monitoring and logging are indispensable in the context of SOC2 compliance for the following reasons:
- Auditability: Logs provide a tamper-proof trail of application activities, essential for auditing processes.
- Incident Detection and Response: Timely detection and response to security incidents are facilitated through comprehensive logging and real-time monitoring.
- Performance Management: Continuous monitoring helps maintain the performance and reliability of the application, thereby adhering to SOC2’s availability requirements.
- Transparency and Accountability: Detailed logs and regular monitoring reports enhance transparency and accountability, which are core principles of SOC2 compliance.
In this guide, we will delve into setting up efficient logging and monitoring systems for FastAPI applications, ensuring your application is well-prepared to meet SOC2 compliance standards. This will include configuring logging, integrating monitoring tools, setting up alerts, managing logs securely, implementing security monitoring, and testing the application’s capacity to handle load using Locust and LoadForge.
By the end of this guide, you will have a comprehensive understanding of how to use FastAPI to build secure, compliant applications and maintain SOC2 compliance through effective monitoring and logging practices.
Setting Up Logging in FastAPI
Proper logging is essential for SOC2 compliance, as it helps track application behavior and identify potential issues. This section will provide a comprehensive guide to setting up a structured logging system within a FastAPI application. We’ll cover using built-in Python logging libraries and third-party tools to ensure all critical events are logged effectively.
Why Logging is Crucial
Logging serves multiple purposes in SOC2 compliance:
- Auditing: Logs provide a way to audit actions and decisions made by the application, aiding in forensic analysis.
- Monitoring: Real-time logs can help in identifying and responding to anomalies or security incidents.
- Accountability: Logs ensure that all significant events, such as user logins, data modifications, and access to sensitive data, are tracked and recorded.
Using Python's Built-in Logging Library
Python's built-in logging module is powerful and highly configurable. Here is a basic setup for logging in a FastAPI application:
import logging
from fastapi import FastAPI
logging.basicConfig(level=logging.INFO,
format='%(asctime)s - %(name)s - %(levelname)s - %(message)s')
app = FastAPI()
@app.get("/")
async def read_root():
logging.info("Root endpoint was accessed.")
return {"Hello": "World"}
@app.post("/items/")
async def create_item(item: dict):
logging.info(f"Item created with data: {item}")
return item
Explanation
logging.basicConfig: This sets up the basic configuration for logging. The level parameter determines the logging level (INFO, DEBUG, WARNING, ERROR, CRITICAL).format: Defines the format of the log messages, including timestamps, logger name, log level, and the actual message.
Structured Logging with loguru
For more advanced logging, loguru is an excellent alternative to Python's built-in logging module. It simplifies the setup process and provides structured logging out of the box.
First, install loguru:
pip install loguru
Then, configure it in the FastAPI application:
from fastapi import FastAPI, Request
from loguru import logger
import sys
logger.remove()
logger.add(sys.stdout, format="{time} {level} {message}", level="INFO")
logger.add("file_{time}.log", rotation="500 MB")
app = FastAPI()
@app.middleware("http")
async def log_requests(request: Request, call_next):
logger.info(f"Request: {request.method} {request.url}")
response = await call_next(request)
logger.info(f"Response: {response.status_code}")
return response
@app.get("/")
async def read_root():
logger.info("Root endpoint was accessed.")
return {"Hello": "World"}
Explanation
logger.add(sys.stdout, format, level): Directs logs to standard output with a specific format and log level.logger.add("file_{time}.log", rotation): Saves logs to a file with automatic rotation based on file size.- Middleware: Middleware logs each request and response, capturing important details for auditing and monitoring.
Using Third-party Tools
Integrating third-party logging and monitoring tools enhances the ability to manage logs at scale and in a more structured manner. Here are a few options:
Sentry
Sentry is a popular error tracking service that can be integrated into a FastAPI application for advanced logging and monitoring:
-
Install Sentry SDK:
pip install sentry-sdk
-
Configure Sentry in FastAPI:
import sentry_sdk
from fastapi import FastAPI
from sentry_sdk.integrations.asgi import SentryAsgiMiddleware

sentry_sdk.init(dsn="YOUR_SENTRY_DSN")

app = FastAPI()
app.add_middleware(SentryAsgiMiddleware)

@app.get("/")
async def read_root():
    return {"Hello": "World"}
ELK Stack (Elasticsearch, Logstash, Kibana)
The ELK Stack is a powerful suite for log aggregation, storage, and visualization. A detailed setup for ELK integration is beyond the scope of this guide, but here’s a high-level overview:
- Elasticsearch: Stores and indexes log data.
- Logstash: Processes and forwards log data to Elasticsearch.
- Kibana: Visualizes log data from Elasticsearch.
Final Thoughts
Setting up logging in FastAPI is crucial for meeting SOC2 requirements. Whether you use Python's built-in logging, loguru, or integrate with third-party tools, the goal is to create a robust, scalable logging framework that captures all critical events. This ensures transparency, accountability, and enhances application security.
In the next section, we will explore integrating monitoring tools like Prometheus and Grafana with FastAPI to gather and visualize operational metrics. This step, combined with effective logging, will further fortify your application’s compliance readiness.
Integrating Monitoring Tools
Effective monitoring is crucial for maintaining SOC2 compliance in your FastAPI application. This section will guide you through integrating powerful monitoring tools like Prometheus and Grafana to gather and visualize application metrics. Capturing and analyzing these metrics will help you ensure your application meets SOC2 requirements by providing critical insights into your system's performance and security.
Setting Up Prometheus with FastAPI
Prometheus is an open-source systems monitoring and alerting toolkit. It is particularly well-suited for time series data and excels at capturing real-time metrics. To integrate Prometheus with FastAPI, follow these steps:
-
Install Dependencies:
First, install the necessary Python libraries for Prometheus.
pip install prometheus_client
-
Create a Metrics Endpoint:
Add a new endpoint to your FastAPI application that Prometheus can scrape for metrics.
from fastapi import FastAPI
from prometheus_client import Counter, generate_latest
from starlette.responses import Response
import time

app = FastAPI()

REQUEST_COUNT = Counter("request_count", "Total number of requests")

@app.middleware("http")
async def add_prometheus_metrics(request, call_next):
    start_time = time.time()
    response = await call_next(request)
    process_time = time.time() - start_time

    REQUEST_COUNT.inc()
    return response

@app.get("/metrics")
def metrics():
    return Response(generate_latest(), media_type="text/plain")
-
Configure Prometheus:
Update the prometheus.yml configuration file to scrape your FastAPI app's metrics endpoint.
scrape_configs:
- job_name: "fastapi"
static_configs:
- targets: ["localhost:8000"]
-
Start Prometheus:
Launch Prometheus with your updated configuration.
prometheus --config.file=prometheus.yml
Visualizing Metrics with Grafana
Grafana is an open-source platform for monitoring and observability that lets you create customizable dashboards. Here's how to integrate Grafana with Prometheus and FastAPI:
-
Install Grafana:
Follow Grafana's installation guide for your operating system.
-
Add Prometheus Data Source:
- Open Grafana UI (
http://localhost:3000 by default).
- Navigate to Configuration > Data Sources.
- Click Add data source and select Prometheus.
- Set the URL to Prometheus' endpoint (e.g.,
http://localhost:9090) and save.
-
Create a Dashboard:
- Navigate to Dashboards > Manage > New Dashboard.
- Add a new panel with a Prometheus query to visualize metrics, e.g.,
rate(request_count[5m])
- Customize the visualization (e.g., graph, gauge) to meet your needs.
Capturing SOC2-Relevant Data
For SOC2 compliance, it is essential to capture and visualize data that reflects your application's security and operational health. Key metrics to monitor include:
- Request Metrics: Number of requests processed, request rates, error rates.
- Latency Metrics: Response times, processing times.
- Error Tracking: Count and types of errors or exceptions.
- Resource Utilization: CPU and memory usage, database connections.
- Security Events: Unauthorized access attempts, rate-limiting triggered events.
Consider configuring alerts in Grafana based on these metrics to proactively address issues before they impact your compliance status.
Conclusion
By integrating Prometheus and Grafana with your FastAPI application, you can effectively monitor the performance and health of your system. Gathering these metrics not only helps in maintaining SOC2 compliance but also provides valuable insights for improving the overall robustness of your application.
Creating Log Alerts and Notifications
To ensure your FastAPI application meets SOC2 requirements, it is crucial to implement an effective log alerting and notification system. This system will help you to quickly respond to critical events and maintain the integrity and security of your application. In this section, we will cover how to set up alert systems based on logged events and metrics, and how to configure alert thresholds. We will also demonstrate how to integrate popular tools like PagerDuty and Slack for incident notifications.
Configuring Alerts
The first step in setting up alerts is to identify the critical events and metrics that need monitoring. These could include error messages, security breaches, or performance degradation.
1. Define Alert Criteria
Decide on the specific conditions under which alerts should be triggered. Here are some common scenarios:
- Error Rates: Trigger an alert if the rate of HTTP 5xx errors exceeds a threshold.
- Response Time: Alert if the response time of critical endpoints exceeds a limit.
- Security Events: Notify on failed login attempts or suspicious activities.
Using Prometheus and Grafana for Alerting
Prometheus, combined with Grafana, provides a robust solution for monitoring and alerting.
2. Setup Prometheus Alerting Rules
Define alerting rules in Prometheus. Here’s an example of a rule to alert on high error rates:
groups:
  - name: fastapi_alerts
    rules:
      - alert: HighErrorRate
        expr: sum(rate(http_requests_total{status="5xx"}[1m])) / sum(rate(http_requests_total[1m])) * 100 > 1
        for: 2m
        labels:
          severity: critical
        annotations:
          summary: "High error rate detected"
          description: "Error rate has exceeded 1% for more than 2 minutes."
3. Integrate Prometheus with Alertmanager
Prometheus uses Alertmanager to handle notifications. Configure Alertmanager to route alerts to different receivers like Slack, PagerDuty, etc. Here’s a snippet for Slack integration:
receivers:
  - name: 'slack'
    slack_configs:
      - api_url: 'https://hooks.slack.com/services/TOKEN'
        channel: '#alerts'
        text: '{{ range .Alerts }}{{ .Annotations.summary }} - {{ .Annotations.description }}{{ end }}'
Integrating PagerDuty
PagerDuty can be used to escalate critical alerts to the right personnel.
4. Setup Alertmanager to Send Alerts to PagerDuty
Configure a receiver for PagerDuty in Alertmanager:
receivers:
  - name: 'pagerduty'
    pagerduty_configs:
      - service_key: 'PAGERDUTY_SERVICE_KEY'
5. Configure PagerDuty Dashboard
In the PagerDuty dashboard, configure the integration to connect with Alertmanager. This allows incidents to be created based on the alerts sent from Prometheus.
Using FastAPI Middleware for Alerts
You can also use FastAPI's middleware to log events and trigger alerts.
from fastapi import FastAPI, Request
import logging
import httpx

app = FastAPI()
logger = logging.getLogger("fastapi_alerts")

@app.middleware("http")
async def log_and_notify(request: Request, call_next):
    response = await call_next(request)
    if response.status_code >= 500:
        message = f"Error {response.status_code} on {request.url.path}"
        logger.error(message)
        await send_pagerduty_alert(message)
    return response

async def send_pagerduty_alert(message: str):
    async with httpx.AsyncClient() as client:
        payload = {"service_key": "PAGERDUTY_SERVICE_KEY", "event_type": "trigger", "description": message}
        await client.post("https://events.pagerduty.com/v2/enqueue", json=payload)
Best Practices for Alerting
- Minimize Noise: Ensure that only actionable alerts are sent to avoid alert fatigue.
- Set Clear Thresholds: Define thresholds that are realistic and based on your application's performance baseline.
- Regularly Review Alerts: Periodically review and adjust alert configurations based on new insights and application changes.
By meticulously setting up alerts and notifications, you ensure that your FastAPI application promptly addresses issues, thereby maintaining compliance with SOC2 requirements. This proactive approach in monitoring and logging is essential for the reliability and security of your application.
Storing and Managing Logs
Effective log management is critical for achieving SOC2 compliance in your FastAPI application. This section will guide you on securely storing logs and managing log retention policies. These practices ensure that your logs are not only secure but also accessible for auditing and compliance purposes.
Choosing the Right Logging Storage Solution
Choosing the appropriate storage solution for your logs is pivotal. Here are some options:
- Local File System: Suitable for small-scale applications or development environments.
- Cloud Storage Solutions: Ideal for scalable, secure, and redundant log storage.
- Log Management Services: Services like ELK Stack (Elasticsearch, Logstash, Kibana), AWS CloudWatch, or Splunk offer powerful log management capabilities.
Configuring Logging Storage in FastAPI
To configure your FastAPI applications to store logs securely, we'll use Python's built-in logging module along with cloud storage solutions.
Example: Amazon S3 for Log Storage
Here is how you can set up logging to store logs in Amazon S3:
-
Install Required Libraries:
pip install boto3
-
Configure Logging in FastAPI:
import logging
from logging.handlers import RotatingFileHandler
import boto3
from botocore.exceptions import NoCredentialsError
logger = logging.getLogger('my_fastapi_app')
logger.setLevel(logging.INFO)
handler = RotatingFileHandler('app.log', maxBytes=2000, backupCount=5)
logger.addHandler(handler)
def upload_logs_to_s3(file_name, bucket, object_name=None):
s3_client = boto3.client('s3')
try:
response = s3_client.upload_file(file_name, bucket, object_name or file_name)
except NoCredentialsError:
logger.error("Credentials not available")
return response
upload_logs_to_s3('app.log', 'my-log-bucket')
Setting Log Retention Policies
Retention policies are crucial for ensuring logs are kept for an appropriate amount of time to meet SOC2 requirements and are then securely deleted. Both cloud storage solutions and log management services allow you to configure retention policies.
Example: AWS S3 Lifecycle Policies
For Amazon S3, you can set up lifecycle rules to automatically transition and eventually delete old log files:
-
Access the S3 Console:
Navigate to the S3 bucket storing your logs.
-
Configure Lifecycle Rule:
- Go to the "Management" tab.
- Click "Create lifecycle rule".
- Set up rules to transition objects to cheaper storage (e.g., S3 Glacier) and eventually delete after a specified time.
Best Practices for Securing Log Data
To ensure log data is secure, follow these best practices:
-
Encryption:
- Encrypt logs at rest using services like AWS KMS for S3.
- Ensure logs in transit are encrypted using TLS/SSL.
-
Access Control:
- Implement strict IAM policies to control access to log storage.
- Use role-based access controls (RBAC) in log management tools.
-
Monitoring and Auditing:
- Regularly monitor access logs for suspicious activities.
- Perform periodic audits to ensure compliance with SOC2 requirements.
Summary
Storing and managing logs securely is essential for SOC2 compliance. By choosing the right storage solutions, setting up robust retention policies, and following best practices for log security, you can ensure your FastAPI application meets rigorous compliance standards. Integrating these practices will help maintain the integrity, availability, and confidentiality of your log data.
By following this guide, you are taking significant steps towards ensuring your FastAPI application adheres to SOC2 logging requirements, providing both security and compliance.
Implementing Security Monitoring
Security monitoring is a key component in maintaining SOC2 compliance, as it enables you to detect and respond to potential security incidents promptly. In this section, we'll explore how to implement robust security monitoring within a FastAPI application. We will cover tools and techniques such as intrusion detection systems and anomaly detection to help safeguard your application from malicious activity.
Intrusion Detection Systems (IDS)
Intrusion Detection Systems (IDS) are essential for monitoring network traffic and detecting suspicious activities. One popular IDS tool is Snort. Snort can be configured to log alerts on suspicious traffic, which you can then integrate with your FastAPI application.
Example: Setting Up Snort with FastAPI
-
Install Snort on your server:
sudo apt-get update
sudo apt-get install snort
-
Configure Snort to log alerts to a file:
Edit the Snort configuration file (usually found at /etc/snort/snort.conf):
output alert_fast: alerts.txt
-
Set up a Python script to read Snort alerts and send notifications:
Create a script named snort_monitor.py:
import time
import os
ALERT_FILE = "/var/log/snort/alerts.txt"
CHECK_INTERVAL = 10
def get_new_alerts():
with open(ALERT_FILE, 'r') as f:
lines = f.readlines()
return lines
while True:
alerts = get_new_alerts()
if alerts:
print("New alerts detected:", alerts)
time.sleep(CHECK_INTERVAL)
Anomaly Detection
Anomaly detection involves identifying patterns in data that do not conform to expected behavior. Libraries like scikit-learn and Pandas can be used in combination with FastAPI to perform real-time anomaly detection.
Example: Anomaly Detection with Scikit-learn
-
Install the necessary libraries:
pip install scikit-learn pandas
-
Create a FastAPI endpoint to handle data and detect anomalies:
from fastapi import FastAPI, Request
from sklearn.ensemble import IsolationForest
import pandas as pd
app = FastAPI()
model = IsolationForest(contamination=0.1)
sample_data = [[1], [2], [1.5], [3.5], [2.5], [12]]
model.fit(sample_data)
@app.post("/detect_anomaly/")
async def detect_anomaly(data: Request):
body = await data.json()
df = pd.DataFrame(body)
anomalies = model.predict(df)
return {"anomalies": anomalies.tolist()}
-
Test the Endpoint:
Using curl or any API testing tool, send a request to the endpoint:
curl -X POST "http://127.0.0.1:8000/detect_anomaly/" -H "Content-Type: application/json" -d '[{"feature1": 3}, {"feature1": 4}, {"feature1": 30}]'
Utilizing Cloud-Based Security Monitoring Solutions
Integrating cloud-based security monitoring solutions can further enhance your application's security posture. Services like AWS CloudWatch, Azure Monitor, and Google Cloud's Security Command Center provide robust monitoring capabilities.
-
AWS CloudWatch:
-
Install the AWS SDK:
pip install boto3
-
Configure CloudWatch Alarms in your FastAPI application:
import boto3

cloudwatch = boto3.client('cloudwatch', region_name='us-west-2')

def create_cloudwatch_alarm():
    response = cloudwatch.put_metric_alarm(
        AlarmName='HighRequestRate',
        ComparisonOperator='GreaterThanThreshold',
        EvaluationPeriods=1,
        MetricName='RequestCount',
        Namespace='AWS/ApiGateway',
        Period=60,
        Threshold=100,
        ActionsEnabled=False,
        AlarmDescription='Alarm when request rate exceeds 100 requests per minute',
        Dimensions=[
            {
                'Name': 'APIName',
                'Value': 'MyFastAPIApp'
            },
        ],
        Statistic='Sum',
    )
    return response

@app.on_event("startup")
async def startup_event():
    create_cloudwatch_alarm()
Conclusion
Implementing security monitoring in FastAPI involves various tools and techniques, from intrusion detection systems to anomaly detection and cloud-based solutions. These implementations not only help in detecting potential security incidents but also align with SOC2 requirements for continuous monitoring.
Ensuring that your FastAPI application is continuously monitored aids in maintaining a strong security posture and contributes significantly towards achieving and maintaining SOC2 compliance.
SOC2 Requirements Checklist
Achieving SOC2 compliance requires a meticulous approach to monitoring and logging to ensure the security, availability, processing integrity, confidentiality, and privacy of data. Here, we provide a comprehensive checklist of SOC2 requirements related to monitoring and logging, mapping them to implemented features and configurations in FastAPI. This ensures all necessary compliance points are covered.
1. Logging of Critical Events
SOC2 compliance requires logging of critical events to detect and respond to potential security incidents:
- User Authentication Events: Log login attempts, successful logins, and logouts.
- Access Control Changes: Track modifications to user roles and permissions.
- Data Access and Modifications: Record actions related to data creation, reading, updating, and deletion.
- Error and Exception Reporting: Log critical exceptions and error codes.
Example:
import logging
from fastapi import FastAPI
app = FastAPI()
logging.basicConfig(level=logging.INFO, format="%(asctime)s - %(name)s - %(levelname)s - %(message)s")
logger = logging.getLogger(__name__)
@app.post("/login")
async def login(user: str, password: str):
logger.info(f"User {user} attempted to login")
return {"message": "Login attempt logged"}
2. Structured Log Formatting
Implement a structured logging system to ensure logs are comprehensible and valuable for auditing:
- Use JSON Format: Structured logs in JSON format can be easily parsed and searched.
- Include Metadata: Embed metadata like timestamp, log levels, user ID, and request IDs.
Example:
import logging
import json_log_formatter

formatter = json_log_formatter.JSONFormatter()

json_handler = logging.FileHandler(filename='app.log')
json_handler.setFormatter(formatter)

logger = logging.getLogger(__name__)
logger.addHandler(json_handler)
logger.setLevel(logging.INFO)

logger.info({
    "event": "user_login",
    "user": "test_user",
    "status": "success"
})
3. Monitoring and Metrics Collection
Integrate monitoring tools to gather real-time metrics and setup dashboards for visualization:
- Prometheus: Install Prometheus client to scrape metrics.
- Grafana: Use Grafana to visualize these metrics.
Example:
from prometheus_client import Counter, generate_latest, REGISTRY
from fastapi import Request, Response

REQUEST_COUNT = Counter('request_count', 'App Request Count', ['method', 'endpoint'])

@app.middleware("http")
async def prometheus_middleware(request: Request, call_next):
    response = await call_next(request)
    REQUEST_COUNT.labels(method=request.method, endpoint=request.url.path).inc()
    return response

@app.get("/metrics")
async def get_metrics():
    return Response(generate_latest(REGISTRY), media_type="text/plain")
4. Alert Configuration
Setting up alerts based on certain log events and metrics to ensure timely incident response:
- PagerDuty Integration: Configure PagerDuty for alert notifications.
- Slack Alerts: Send critical log events to Slack channels.
Example:
import requests
def send_to_slack(message):
url = "https://hooks.slack.com/services/YOUR/SLACK/WEBHOOK"
payload = {"text": message}
requests.post(url, json=payload)
logger.error({"event": "critical_error", "details": "Error details"})
send_to_slack("Critical error occurred: Error details")
5. Secure Logging Protocols
Ensure logs are stored securely and log retention policies are compliant:
- Encrypt Logs: Use encryption to protect log data.
- Cloud Storage: AWS S3 or Azure Blob storage for scalable, secure log storage.
- Retention Policies: Define and enforce log retention policies.
Best Practices:
import boto3
import gzip
from datetime import datetime

s3_client = boto3.client('s3')
bucket_name = 'your-log-bucket'

def save_to_s3(log_data):
    timestamp = datetime.utcnow().strftime('%Y-%m-%dT%H:%M:%SZ')
    filename = f"log-{timestamp}.json.gz"

    with gzip.open(filename, 'wt') as f:
        f.write(log_data)

    s3_client.upload_file(filename, bucket_name, filename)
6. Security Monitoring
Implement security monitoring to detect and respond to potential security incidents:
- IDS/IPS: Intrusion Detection/Prevention Systems
- Anomaly Detection: Use machine learning to detect unusual patterns.
Integration Example:
import os
import subprocess
def setup_ids():
subprocess.run(["apt-get", "install", "ossec"])
os.system("ossec-control start")
setup_ids()
Mapping to SOC2 Compliance
Below is a table mapping the above practices to specific SOC2 Trust Service Criteria (TSC):
| SOC2 TSC |
Implementation Details |
| Security |
Logging user authentications, using IDS |
| Availability |
Monitoring metrics for downtime, alert configuration |
| Processing Integrity |
Validating log data integrity and structure |
| Confidentiality |
Encrypting logs, secure storage solutions |
| Privacy |
Logging and monitoring access to sensitive data |
By following this checklist, you can ensure your FastAPI application is well-equipped to meet SOC2 compliance requirements related to monitoring and logging.
Writing Locust Tests for Your FastAPI Application
Conducting thorough load testing is imperative to ensure that your FastAPI application performs reliably under various load conditions. Locust, a powerful load testing tool, allows you to create detailed test scripts, known as locustfiles, that can simulate multiple user interactions with your application. Here's a step-by-step guide on how to write locustfile scripts for your FastAPI application.
Setting Up Locust
First, ensure Locust is installed. You can install it via pip:
pip install locust
Creating a Basic Locustfile
A locustfile is where you define your load tests. Below is a basic example of a locustfile to get you started:
from locust import HttpUser, task, between

class FastAPIUser(HttpUser):
    wait_time = between(1, 5)

    @task
    def index(self):
        self.client.get("/")

    @task
    def get_item(self):
        self.client.get("/items/1")
Simulating User Interactions
The example above demonstrates a simple user behavior model where the user makes GET requests to the root endpoint (/) and an item endpoint (/items/1). To handle more complex scenarios, you can define additional tasks and simulate various user interactions. Here’s how:
from locust import HttpUser, task, between

class FastAPIUser(HttpUser):
    wait_time = between(1, 5)

    @task
    def index(self):
        self.client.get("/")

    @task
    def list_items(self):
        self.client.get("/items")

    @task
    def get_item(self):
        self.client.get("/items/1")

    @task
    def create_item(self):
        self.client.post("/items", json={"name": "Test Item", "price": 10.99})

    @task
    def update_item(self):
        self.client.put("/items/1", json={"name": "Updated Item", "price": 15.99})

    @task
    def delete_item(self):
        self.client.delete("/items/1")
Advanced Load Test Scenarios
If your application requires more sophisticated testing scenarios, you can create setup/teardown methods and run tasks conditionally based on the responses. For example:
from locust import HttpUser, task, between, TaskSet

class ItemTasks(TaskSet):

    def on_start(self):
        self.client.post("/login", json={"username": "admin", "password": "secret"})

    @task
    def create_and_get_item(self):
        response = self.client.post("/items", json={"name": "Test Item", "price": 10.99})
        if response.status_code == 200:
            item_id = response.json().get("id")
            self.client.get(f"/items/{item_id}")

class FastAPIUser(HttpUser):
    tasks = [ItemTasks]
    wait_time = between(1, 5)
Running Your Load Tests
Once you've created your locustfile, you can run your load tests using the following command:
locust -f locustfile.py --host=http://your-fastapi-app
This command starts the Locust web interface at http://localhost:8089, where you can configure the number of users and spawn rate, and start the test.
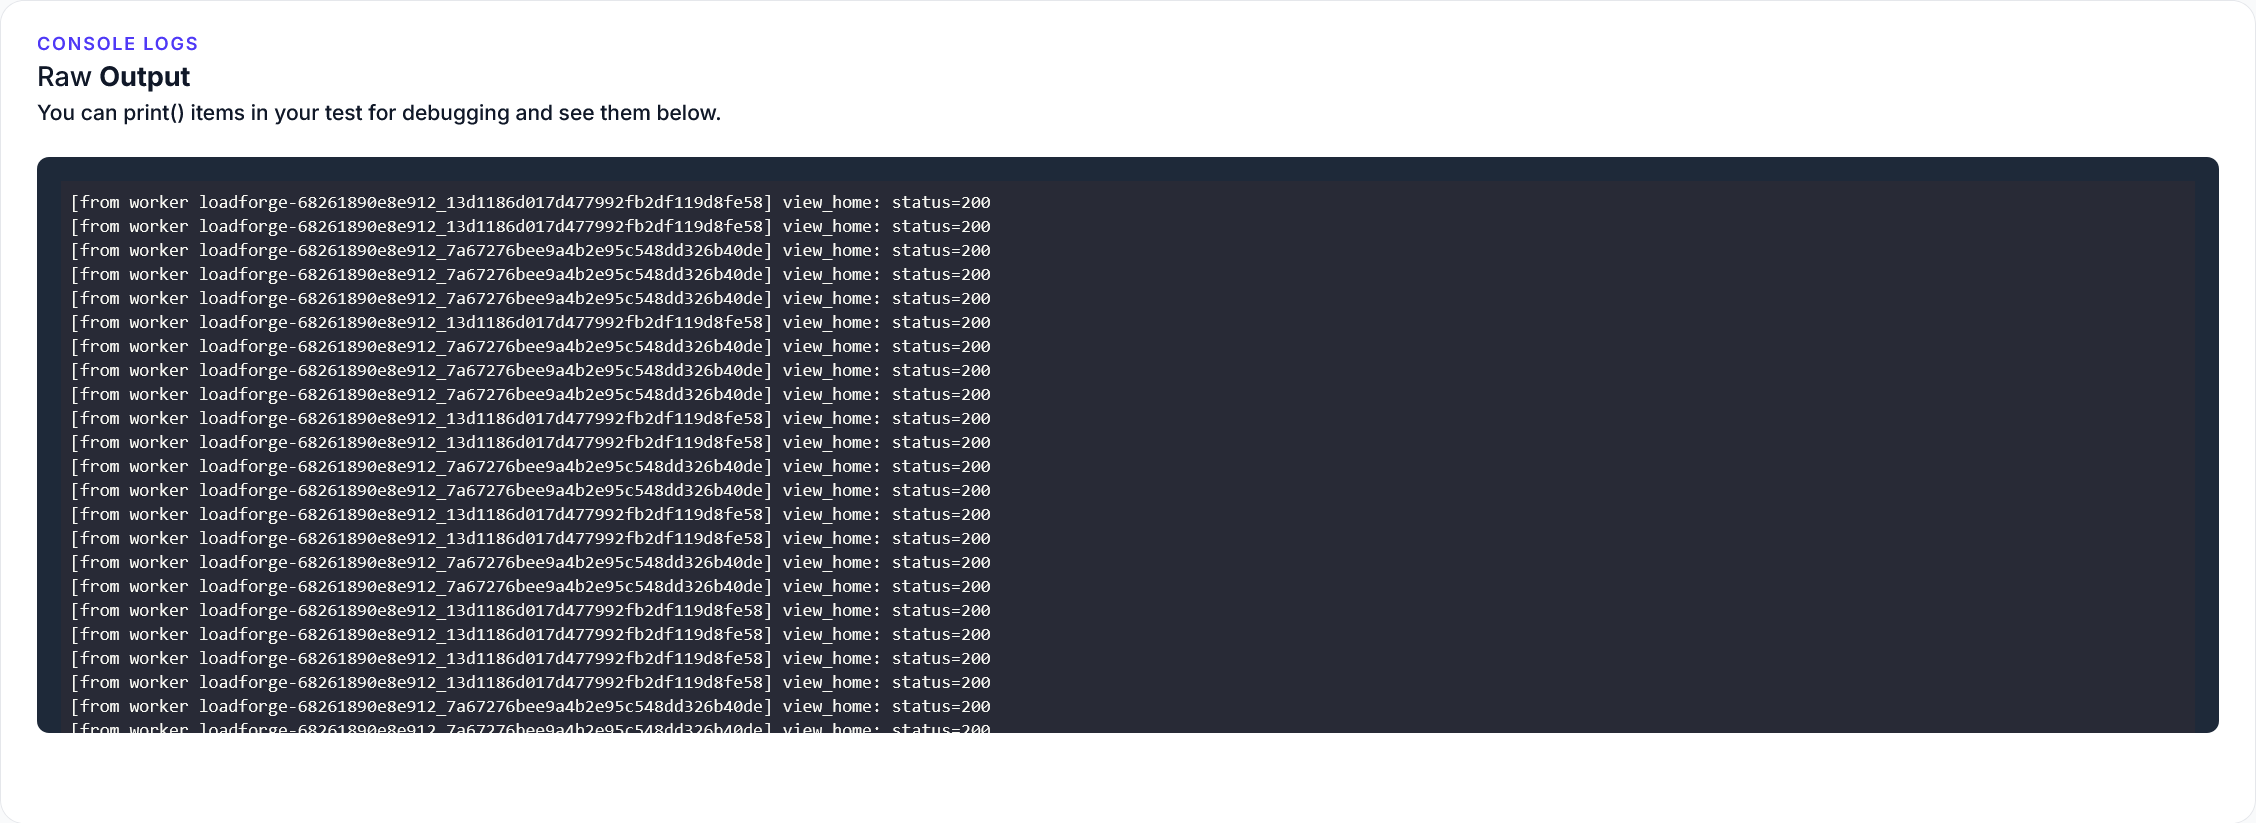
Analyzing Results
Locust provides a real-time web UI to monitor the test's progress and performance metrics. Metrics such as response time, requests per second, and failure rate are displayed, enabling you to evaluate how your FastAPI application handles load.
Example Locustfile for Quick Reference
Below is the complete locustfile incorporating multiple user tasks for comprehensive testing:
from locust import HttpUser, TaskSet, task, between

class ItemTasks(TaskSet):

    def on_start(self):
        self.client.post("/login", json={"username": "admin", "password": "secret"})

    @task
    def create_item(self):
        response = self.client.post("/items", json={"name": "Test Item", "price": 10.99})
        if response.status_code == 200:
            item_id = response.json().get("id")
            self.client.get(f"/items/{item_id}")

    @task
    def update_item(self):
        self.client.put("/items/1", json={"name": "Updated Item", "price": 15.99})

    @task
    def delete_item(self):
        self.client.delete("/items/1")

class FastAPIUser(HttpUser):
    tasks = [ItemTasks]
    wait_time = between(1, 5)
    host = "http://your-fastapi-app"
By systematically load testing various endpoints and operations, you can ensure your FastAPI application performs efficiently under different workloads, contributing to SOC2 compliance and overall application reliability.
Running LoadForge Tests
In this section, we will illustrate how to run load tests using LoadForge, analyze the results, and make necessary adjustments to ensure your FastAPI application meets performance and SOC2 compliance requirements.
Step-by-Step Guide to Running LoadForge Tests
- Prepare Your Locustfile
Before you run LoadForge tests, you need a locustfile.py that defines your user behavior. Here’s a basic example of a Locustfile testing a FastAPI endpoint:
<pre><code>from locust import HttpUser, TaskSet, task, between

class UserBehavior(TaskSet):

    @task(1)
    def index(self):
        self.client.get("/")

    @task(2)
    def items(self):
        self.client.get("/items/1")

class WebsiteUser(HttpUser):
    tasks = [UserBehavior]
    wait_time = between(1, 5)
</code></pre>
In this example, we have two tasks simulating user interactions: one accessing the root URL / and another accessing /items/1.
- Upload Your Locustfile to LoadForge
Log in to your LoadForge account and navigate to the test creation interface. Upload your locustfile.py and configure any environment variables or test parameters required for your application.
- Configure Test Parameters
Next, configure the test parameters, such as the number of users, spawn rate, and test duration. Ensure the configured parameters align with your expected traffic and compliance metrics:
- Number of Users: Define the maximum number of concurrent users.
- Spawn Rate: Set how quickly new users are introduced to the system.
- Test Duration: Specify how long the test should run.
- Initiate the Test
Once your Locustfile is uploaded and parameters are set, initiate the test. LoadForge will deploy the test across multiple locations if specified, providing a realistic simulation of global traffic.
- Monitor Real-Time Metrics
As the test runs, use the LoadForge dashboard to monitor real-time metrics. Key metrics to observe include:
- Response Time: Monitor average response times and identify any latencies.
- Error Rate: Keep an eye on the error rates to spot any potential issues.
- Throughput: Observe the requests per second to gauge the load your application can handle.
Analyzing Test Results
After the test completes, LoadForge provides a detailed report of the test performance. Key sections of the report include:
- Response Time Distribution: Analyze how response times are distributed across different percentiles.
- Error Analysis: Evaluate any errors encountered during the test to identify potential bottlenecks.
- Performance Metrics: Review overall throughput and average response times to ensure they meet acceptable standards.
Making Necessary Adjustments
Based on the analysis:
-
Optimize Application Code:
Identify and optimize any inefficient code or database queries that might be causing slow responses.
-
Scale Infrastructure:
If necessary, adjust your infrastructure by scaling up or out to handle increased loads.
-
Update Configurations:
Tweak configurations such as timeout settings, database connections, and caching mechanisms to improve performance.
Ensuring Continuous Compliance
Load testing should not be a one-time task. Regularly schedule LoadForge tests to continuously monitor and ensure your FastAPI application remains compliant with SOC2 performance requirements. Automate these tests as part of your CI/CD pipeline to catch issues early in the development cycle.
Conclusion
By following these steps, you can effectively use LoadForge to load test your FastAPI application, ensuring it can handle the anticipated load while meeting SOC2 compliance requirements. Regular testing and analysis will help you maintain high performance and reliability standards for your application.
Conclusion
In this guide, we have delved into the essential aspects of monitoring and logging within a FastAPI application to achieve SOC2 compliance. By following the steps and best practices outlined, you are equipped with the knowledge to build secure, reliable, and compliant applications. Let’s summarize the key points we covered and emphasize the importance of continuous monitoring and logging.
Key Takeaways
-
Importance of SOC2 Compliance:
- Ensuring SOC2 compliance is crucial for building trust with your customers and clients, demonstrating that your organization can securely manage data to protect the interests and privacy of its clients.
- Monitoring and logging are central to achieving and maintaining SOC2 certification as they provide the necessary transparency and accountability.
-
Logging in FastAPI:
- Established a structured logging system using both built-in Python logging libraries and third-party tools to capture and persist critical events.
- Ensured that logs are formatted and stored in a manner that facilitates easy retrieval and analysis for audits.
-
Integrating Monitoring Tools:
- Integrated monitoring tools like Prometheus and Grafana to gather real-time metrics and visualize application performance.
- Focused on capturing data pertinent to SOC2 compliance, aiding in proactive performance management and issue resolution.
-
Log Alerts and Notifications:
- Set up alert systems using tools like PagerDuty or Slack to notify relevant teams of critical events and metrics thresholds.
- Configured alert thresholds to prompt timely responses to potential incidents, ensuring continuous operational integrity.
-
Storing and Managing Logs:
- Implemented secure storage solutions and log retention policies to comply with SOC2 requirements.
- Emphasized best practices for securing log data, including encryption and restricted access controls.
-
Security Monitoring:
- Integrated security monitoring features within FastAPI to detect and respond to potential security incidents.
- Utilized tools and techniques such as intrusion detection systems and anomaly detection to safeguard application environments.
-
SOC2 Requirements Checklist:
- Provided a comprehensive checklist mapping SOC2 requirements to specific logging and monitoring practices implemented in FastAPI.
- Ensured all necessary compliance points were addressed, aiding in a thorough and streamlined SOC2 audit process.
-
Locust Testing for FastAPI:
- Demonstrated how to write locustfile scripts for load testing FastAPI applications, simulating various user interactions.
- Ensured the application performs well under load, identifying potential bottlenecks and areas for improvement.
-
Running LoadForge Tests:
- Illustrated running load tests using LoadForge, with steps to analyze the results and make necessary adjustments.
- Highlighted the importance of load testing in meeting performance and compliance requirements.
Final Tips and Best Practices
-
Adopt a Proactive Monitoring Approach: Regularly review your logging and monitoring configurations to ensure they remain aligned with evolving SOC2 requirements and your application’s behavior.
-
Automate Where Possible: Implement automated alerting and incident response mechanisms to reduce downtime and ensure swift remediation of issues.
-
Regular Audits and Reviews: Periodically audit your logs and monitoring data to verify that all SOC2 compliance points are consistently met.
-
Educate Your Team: Ensure that your development and operational teams are well-versed in SOC2 requirements and understand the importance of maintaining robust logging and monitoring practices.
-
Consistency and Reliability: Keep your monitoring and logging systems reliable and consistent, ensuring they function as intended even under peak loads.
Maintaining SOC2 compliance is an ongoing journey that requires diligence, attention to detail, and a commitment to continuous improvement. By implementing the strategies and best practices outlined in this guide, you can ensure that your FastAPI applications are not only compliant but also resilient and secure.
Remember, the ultimate goal is to build trust with your users by demonstrating that you take data security seriously and are committed to protecting their information. Happy monitoring and logging!