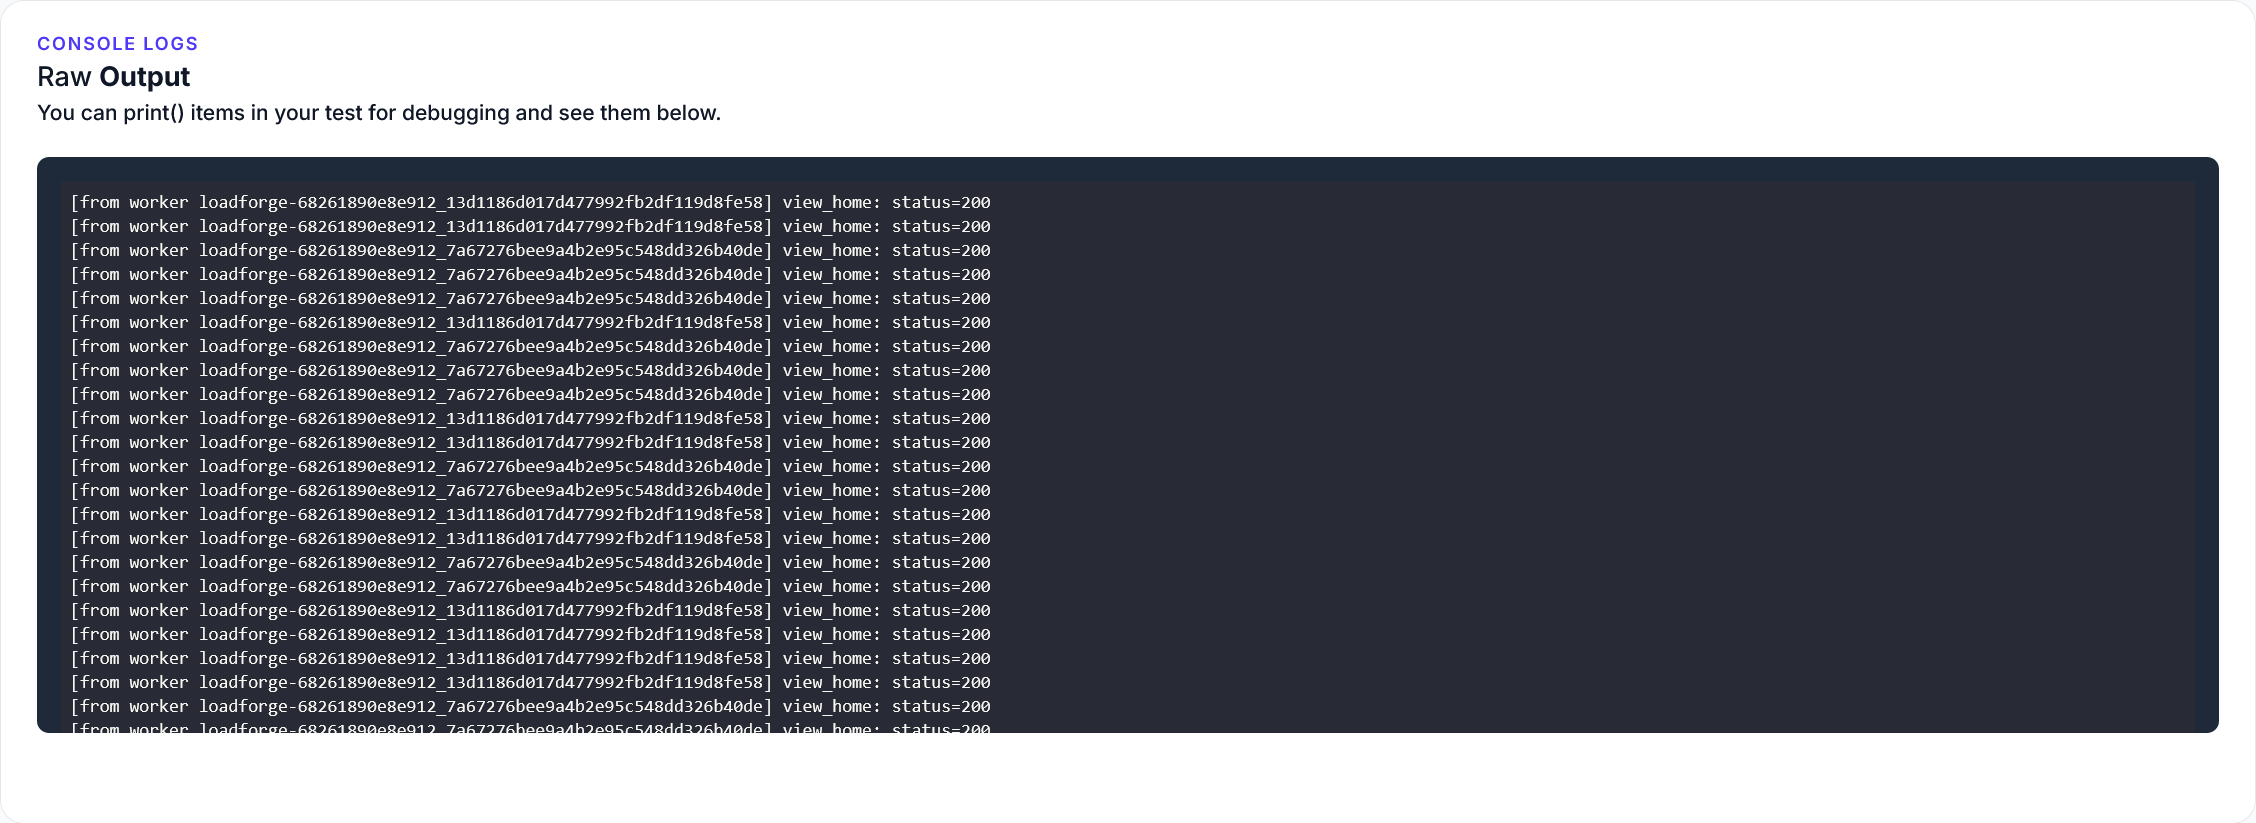
Easier Debug Logging
We're excited to announce a powerful new feature for LoadForge users: comprehensive debug logging for test runs. This highly requested...
Performance optimization is a critical aspect of modern web application development, and ensuring that your Laravel application runs smoothly can significantly enhance the user experience, boost your application's SEO, and reduce server costs. As the number of users and the...

Performance optimization is a critical aspect of modern web application development, and ensuring that your Laravel application runs smoothly can significantly enhance the user experience, boost your application's SEO, and reduce server costs. As the number of users and the complexity of applications grow, even minor performance bottlenecks can lead to substantial slowdowns, highlighting the importance of regular performance tuning and monitoring.
Laravel, one of the most popular PHP frameworks, offers a robust and elegant platform for building web applications. However, out-of-the-box performance may not always be optimal for all use cases, making it essential to leverage specialized packages designed to help analyze, debug, and improve your application's speed and efficiency.
In this guide, we'll explore the top 10 Laravel packages that can help you boost your application's performance. These packages provide tools for profiling and monitoring, error tracking, response caching, and much more. Here's a brief overview of what we will cover:
Finally, we’ll discuss the importance of load testing with LoadForge. This section will cover why load testing is essential for performance benchmarking and how you can use LoadForge to test, analyze, and optimize your Laravel application under various load conditions.
By the end of this guide, you'll have a comprehensive understanding of how to leverage these packages to ensure your Laravel application runs at peak performance, offering users a seamless and efficient experience. Let's dive in!
Performance optimization and debugging go hand-in-hand when developing a robust Laravel application. One of the most effective tools for this process is the Laravel Debugbar, a highly versatile package that provides developers with profound insights into their application's performance characteristics.
Laravel Debugbar is an essential package designed by Barry vd. Heuvel to integrate PHP Debug Bar with Laravel applications. It aids in debugging by providing real-time data about requests, views, routes, and much more. This package can significantly streamline the process of identifying performance bottlenecks and optimizing your application's overall efficiency.
To get started with Laravel Debugbar, you need to install it via Composer:
composer require barryvdh/laravel-debugbar --devAfter installation, if you are using Laravel 5.5 or above, the package will auto-register. For older versions, you may need to add the Service Provider manually in your config/app.php:
'providers' => [
    // Other service providers...
    Barryvdh\Debugbar\ServiceProvider::class,
],
You can publish the configuration file using the command:
php artisan vendor:publish --provider="Barryvdh\Debugbar\ServiceProvider"Once installed, Laravel Debugbar will automatically append a debugging toolbar to your application's pages, as long as they are rendered in the browser. This toolbar displays various tabs with comprehensive details about requests, exceptions, database queries, timing, and much more.
One of Laravel Debugbar's standout features is its performance profiling capabilities. By identifying slow database queries and time-consuming view renderings, you'll gain actionable insights into parts of your application that need optimization. For instance, the Queries tab helps you:
Another powerful feature is custom timing. You can measure specific parts of your code using the Debugbar::startMeasure and Debugbar::stopMeasure methods.
use Debugbar;

// Start a custom measure
Debugbar::startMeasure('render','Time for rendering');

// Your code...

// Stop the measure
Debugbar::stopMeasure('render');
Laravel Debugbar also supports debugging Ajax requests with ease. All you need to do is enable it in the configuration file, and Debugbar will capture and display debugging information for your asynchronous calls.
Laravel Debugbar is an indispensable tool for developers seeking to optimize and debug their Laravel applications. By leveraging its extensive features for performance profiling and real-time debugging, you can identify bottlenecks, reduce response times, and ultimately provide a smoother and faster user experience.
When it comes to managing and monitoring queues in Laravel, Laravel Horizon is an indispensable tool. This powerful package not only provides a beautiful dashboard to monitor your Redis queues but also comes with an array of features that help optimize and improve the performance of your queued jobs. In this section, we'll delve into the role of Laravel Horizon, its capabilities, and how it can enhance the performance of your Laravel application.
To get started with Laravel Horizon, you first need to install the package using Composer:
composer require laravel/horizonNext, publish the Horizon assets using the artisan command:
php artisan horizon:installFinally, run the migrations to set up the necessary database tables:
php artisan migrateHorizon’s configuration file can be found at config/horizon.php. Here, you can define your environments, queue worker configurations, and other settings.
An example of a simple configuration might look like this:
'defaults' => [
    'supervisor-1' => [
        'connection' => 'redis',
        'queue' => ['default'],
        'balance' => 'simple',
        'processes' => 10,
        'tries' => 3,
    ],
],
This configuration will start a supervisor that listens on the redis connection for jobs on the default queue. It will spawn 10 worker processes and will try each job up to 3 times before marking it as failed.
With your configuration in place, start Horizon using the following artisan command:
php artisan horizonHorizon will start processing jobs based on your configuration. You can access the Horizon dashboard by navigating to /horizon in your application.
Laravel Horizon mainly boosts performance by offering the following benefits:
In conclusion, Laravel Horizon is not merely a monitoring tool but also a critical component for enhancing the performance, reliability, and scalability of your Laravel application's queue system. By integrating Horizon into your workflow, you can ensure that your job processing is as efficient as possible, providing a smoother experience for both your users and your development team.
With Horizon in place, the next step in ensuring your application's optimal performance is load testing. In the subsequent section, we'll explore how LoadForge can help you conduct comprehensive load tests to further fine-tune your Laravel applications.
Laravel Telescope is an elegant debugging assistant designed to help you gain insights into your Laravel application's performance and behavior in real-time. It provides a concise and beautiful dashboard to monitor various aspects of your application, making it an essential tool for developers aiming to optimize and debug their applications more efficiently.
Laravel Telescope offers a myriad of features that allow you to deeply analyze your application's operations:
Request Monitoring: Track all incoming HTTP requests, including headers, session data, request input, and response output.
Exception Handling: Capture and log all exceptions thrown by your application, along with detailed stack traces and contextual data.
Database Query Monitoring: Monitor the SQL queries executed by your application, their bindings, and execution times, helping you identify slow queries.
Log Viewer: Centralized viewing of your application's log entries, making it easier to diagnose issues quickly.
Queue Monitoring: Track your queue jobs, including their payloads, process times, and any exceptions they may throw.
Mail Monitoring: View sent emails' details, such as recipients, subject lines, and content.
Notification Monitoring: Keep track of all notifications sent by your application, whether via email, SMS, or other channels.
Cache Monitoring: Observe your cache statistics, including keys being set, retrieved, and cleared.
Scheduled Tasks: Monitor your application's scheduled tasks, including their output and execution times.
Command Monitoring: Track the artisan commands your application runs, including the outputs and execution times.
By providing visibility into these critical areas of your application, Laravel Telescope plays a vital role in performance optimization and debugging:
Performance Insights: Telescope enables you to identify bottlenecks and performance issues by examining details such as long-running queries, slow requests, and inefficient queue jobs.
Error Tracking: By logging all exceptions and errors, Telescope helps you quickly pinpoint and debug issues, leading to higher application reliability.
Historical Data: Telescope keeps a historical record of monitored data. This enables developers to go back in time and analyze what happened during a particular time frame, aiding in retrospective problem-solving.
While Laravel Telescope is a powerful monitoring tool, it's worth noting that it can introduce some overhead due to the data it collects and processes. However, the benefits of visibility and debugging usually outweigh the minor performance impacts. To mitigate any potential performance hit:
Environment-Specific Configuration: Enable Telescope only in your local or development environments to avoid unnecessary overhead in production.
Batching and Filtering: Telescope provides options to batch and filter the data it collects, allowing you to control the granularity and volume of monitored entries.
Tagging and Pruning: Use Telescope's tagging and pruning features to manage the size of your log entries, ensuring the database remains performant.
To get started with Laravel Telescope, you can install it via Composer and publish its configuration:
composer require laravel/telescope --dev
php artisan telescope:install
php artisan migrate
After installation, you can access the Telescope dashboard by navigating to /telescope in your application's browser.
// Example of how to configure Telescope to be environment-specific
if (app()->environment('local')) {
    $this->app->register(TelescopeServiceProvider::class);
}
By integrating Laravel Telescope into your workflow, you ensure that your Laravel application remains performant, robust, and well-monitored, providing a valuable foundation for further optimization.
Navigating through Telescope's comprehensive dashboard will empower you to keep a vigilant eye on your application's health, leading to more efficient debugging and performance tuning processes.
The Spatie Laravel Responsecache package is an exceptional tool designed to significantly boost your application’s performance by caching responses. By storing responses and serving them from the cache, this package reduces the load on your server, minimizes database queries, and speeds up response times for users. Let's dive into how you can leverage Spatie Laravel Responsecache to enhance your Laravel application's performance.
To install the Spatie Laravel Responsecache package, use the following Composer command:
composer require spatie/laravel-responsecache
Once the package is installed, you need to publish the configuration file using:
php artisan vendor:publish --provider="Spatie\ResponseCache\ResponseCacheServiceProvider"
This command will create a configuration file named responsecache.php in the config directory.
The minimal required setup in config/responsecache.php involves specifying which URIs should be cached. By default, all GET requests will be cached. Here’s a basic configuration:
return [

    /*
     * The fully qualified class name of the cache profile.
     */
    'cache_profile' => \Spatie\ResponseCache\CacheProfiles\DefaultCacheProfile::class,

    /*
     * Here you may define the cache store that should be used for storing cached responses.
     *
     * You can use any of the cache stores defined in the cache.php config file in this array.
     */
    'cache_store' => env('RESPONSE_CACHE_DRIVER', 'file'),

    /*
     * This key will be prefixed when storing items in the cache.
     */
    'cache_key_prefix' => 'responsecache',

    /*
     * Here you may define if requests with the following inputs should not be cached.
     */
    'cache_input_expires' => false,

    /*
     * Specify the routes to cache here.
     */
    'cache_routes' => [
        'GET', // Default caching for all GET requests
    ],
];
If you have special requirements, such as conditionally caching only certain routes or responses, you can create a custom cache profile:
namespace App\CacheProfiles;

use Spatie\ResponseCache\CacheProfiles\BaseCacheProfile;
use Illuminate\Http\Request;
use Symfony\Component\HttpFoundation\Response;

class CustomCacheProfile extends BaseCacheProfile
{
    public function shouldCacheRequest(Request $request): bool
    {
        return $request->isMethod('GET') && $request->routeIs('cacheable-route');
    }

    public function shouldCacheResponse(Response $response): bool
    {
        return $response->isSuccessful();
    }
}
Then, update your responsecache.php configuration to use your custom cache profile:
'cache_profile' => \App\CacheProfiles\CustomCacheProfile::class,
Proper cache invalidation is crucial to ensuring that users receive the most up-to-date content. Spatie Laravel Responsecache provides straightforward methods to clear cache programmatically:
// Clear the entire cache
ResponseCache::clear();

// Clear cache for specific URL
ResponseCache::forget('/url-to-forget');
To integrate the caching mechanism within your routes, attach the middleware provided by the package:
Route::middleware('responsecache')->group(function () {
    Route::get('/posts', 'PostController@index')->name('cacheable-route');
});
Utilizing the Spatie Laravel Responsecache package can drastically improve your Laravel application's performance by minimizing redundant work and quickly serving cached responses. With flexible configuration options and easy integration, it seamlessly fits into existing Laravel projects, allowing you to optimize both backend processes and user-facing performance.
Laravel Octane is a package that supercharges your Laravel application's performance by handling requests concurrently, utilizing high-performance application servers such as Swoole or RoadRunner. This enables your application to process multiple requests simultaneously, significantly reducing the response time and improving the overall throughput.
Implementing Laravel Octane into your application is straightforward:
First, you need to install Laravel Octane using Composer:
composer require laravel/octaneNext, choose and install one of the supported application servers – either Swoole or RoadRunner. For example, to install Swoole:
composer require swoole/ide-helperPublish the Octane configuration file:
php artisan vendor:publish --tag=octane-configModify the configuration file (config/octane.php) according to your needs. You can configure various settings such as:
servers – Define which server you are using (Swoole or RoadRunner).workers – Set the number of worker processes.task_workers – Configure task worker settings for handling background tasks.After configuration, you can start the Octane server. If using Swoole, execute:
php artisan octane:start --server=swooleFor RoadRunner, use:
php artisan octane:start --server=roadrunnerHere's a simple example of how Laravel Octane can be utilized in a Laravel application:
Route::get('/', function () {
    // This endpoint will now benefit from Octane's concurrent processing and reduced response times!
    return 'Hello Octane!';
});
By following these steps, your Laravel application will be supercharged with the performance-enhancing capabilities of Laravel Octane, allowing it to handle higher loads and deliver faster responses effectively.
Continuously monitor and tweak the Octane configuration to suit your application needs and ensure optimal performance.
In any web application, error tracking and performance monitoring are integral to ensuring a smooth user experience and maintaining high performance. The Sentry Laravel package is a powerful tool that offers comprehensive error tracking and performance monitoring capabilities, making it an essential component for optimizing a Laravel application's performance.
Sentry Laravel provides real-time error tracking, which helps developers promptly detect, diagnose, and fix issues as they occur. Here’s how it benefits your Laravel application:
To integrate Sentry into your Laravel application, follow these steps:
Install the Sentry Laravel Package: Use Composer to install the package.
composer require sentry/sentry-laravelConfigure the Sentry DSN: Add your Sentry DSN to the .env file.
SENTRY_LARAVEL_DSN=https://[email protected]/0Add Sentry Service Provider: Register the Sentry service provider and facade in the config/app.php.
 'providers' => [
     // ...
     Sentry\Laravel\ServiceProvider::class,
 ],

 'aliases' => [
     // ...
     'Sentry' => Sentry\Laravel\Facade::class,
 ],
Publish the Sentry Configuration: Use Artisan to publish the Sentry configuration file.
php artisan vendor:publish --provider="Sentry\\Laravel\\ServiceProvider"Sentry Laravel does more than track errors; it also offers robust performance monitoring tools. These tools help you gain insights into various aspects of your application's performance:
Here’s an example of configuring performance monitoring with Sentry in Laravel:
Enable Performance Monitoring: Update the Sentry configuration file (config/sentry.php) to enable tracing.
'traces_sample_rate' => env('SENTRY_TRACES_SAMPLE_RATE', 1.0),
Environment Variable: Add the SENTRY_TRACES_SAMPLE_RATE environment variable in your .env file to control the sampling rate.
SENTRY_TRACES_SAMPLE_RATE=1.0By leveraging Sentry's error tracking and performance monitoring features, you can proactively manage and optimize your application, ensuring a high level of performance and reliability.
Incorporating Sentry Laravel into your application’s performance strategy provides a dual benefit of readily identifying and addressing errors while gaining deep insights into various performance metrics. This combination is invaluable for maintaining and enhancing the overall performance of your Laravel application.
Optimizing database performance is crucial for any Laravel application, and one common issue that can severely impact performance is the N+1 query problem. The Laravel Query Detector package is a powerful tool designed to identify and help you mitigate such issues, significantly improving your database query performance.
Before diving into the package, it's essential to understand what the N+1 query problem is. This issue occurs when your application executes a query to retrieve a list of items (N queries) and then executes another query for each item to fetch related data (+1 query). This can result in a massive number of unnecessary queries, slowing down your application.
The Laravel Query Detector package automatically scans your application for N+1 query issues and notifies you when they occur. By doing so, it enables you to address these problems proactively, often by eager loading relationships, thereby reducing the number of queries and boosting performance.
To install the Laravel Query Detector package, simply run:
composer require beyondcode/laravel-query-detector --dev
After installing the package, you need to register the service provider. In your config/app.php, add the following line to the providers array:
BeyondCode\QueryDetector\QueryDetectorServiceProvider::class,
By default, the package will start detecting N+1 queries out of the box. However, you can customize its behavior by publishing the configuration file:
php artisan vendor:publish --provider="BeyondCode\QueryDetector\QueryDetectorServiceProvider"
This will create a config/querydetector.php file where you can fine-tune settings as needed.
Once set up, Laravel Query Detector will monitor your queries and alert you of N+1 issues in various ways:
Here is an example of how you might encounter an N+1 query problem and address it:
class UserController extends Controller
{
    public function index()
    {
        $users = User::all(); // Fetching all users

        foreach ($users as $user) {
            echo $user->profile->bio; // This will trigger N+1 queries as it loads profile for each user separately
        }
    }
}
class UserController extends Controller
{
    public function index()
    {
        $users = User::with('profile')->get(); // Eager loading profiles along with users

        foreach ($users as $user) {
            echo $user->profile->bio; // This uses the already loaded profile data, preventing N+1 queries
        }
    }
}
By integrating the Laravel Query Detector package into your development workflow, you can significantly enhance your application's database performance, resulting in faster load times and a more responsive user experience.
When it comes to enhancing search functionality within Laravel applications, Laravel Scout is an indispensable package. It integrates seamlessly with popular search engines like Algolia, facilitating the creation of lightning-fast search indexes. The speed and efficiency offered by Laravel Scout can significantly boost the overall performance of your application.
Laravel Scout provides a simple, driver-based solution for adding full-text search to your Eloquent models. This package makes it easy to synchronize your search indexes based on the data in your database, providing a fast and effective search experience for your users.
To demonstrate how Laravel Scout can be utilized, let's focus on its integration with Algolia.
First, install Laravel Scout and the Algolia PHP client via Composer:
composer require laravel/scout
composer require algolia/algoliasearch-client-php
Next, publish the Scout configuration file:
php artisan vendor:publish --provider="Laravel\Scout\ScoutServiceProvider"
Add your Algolia credentials to the .env file:
ALGOLIA_APP_ID=your-algolia-app-id
ALGOLIA_SECRET=your-algolia-api-key
In the config/scout.php file, set Algolia as your driver:
'driver' => env('SCOUT_DRIVER', 'algolia'),
Add the Searchable trait to your Eloquent model:
use Laravel\Scout\Searchable;

class Post extends Model
{
    use Searchable;

    // Additional model code...
}
Configure the toSearchableArray method to specify which attributes should be included in the search index:
public function toSearchableArray()
{
    return [
        'id' => $this->id,
        'title' => $this->title,
        'content' => $this->content,
    ];
}
With Laravel Scout, indexing is straightforward. After adding or updating a model, Scout automatically updates the associated search index. To manually index your models, use the scout:import Artisan command:
php artisan scout:import "App\Models\Post"
Laravel Scout's seamless integration with robust search engines like Algolia leads to substantial performance improvements:
To perform a basic search query, use the search method provided by the Scout package:
$posts = Post::search('Eloquent Tips')->get();
This returns a collection of posts matching the search term "Eloquent Tips" from the Algolia index.
By implementing Laravel Scout, you can leverage the powerful indexing and searching capabilities of services like Algolia. This not only speeds up search functionalities but also improves the overall efficiency and scalability of your Laravel application.
Clockwork for Laravel is an excellent profiling and monitoring tool tailored specifically for Laravel applications. It provides developers with deep insights into application performance, allowing them to identify bottlenecks, optimize query performance, and improve the overall efficiency of their applications.
To get started with Clockwork, you need to install the package via Composer:
composer require itsgoingd/clockwork --devAfter installation, you need to add the Clockwork service provider to your config/app.php file:
'providers' => [
    ...
    Clockwork\Support\Laravel\ClockworkServiceProvider::class,
],
Finally, publish the configuration file using:
php artisan vendor:publish --tag=clockworkThis will create a clockwork.php configuration file in your config directory, allowing you to customize Clockwork’s settings based on your application's needs.
Clockwork provides a wealth of features that make it an invaluable tool for performance optimization:
Detailed Request Profiling: Clockwork captures detailed information about each request made to your application, including request headers, response headers, session data, and more. This helps in understanding exactly what happens during each request lifecycle.
Database Queries Analysis: With Clockwork, you can view all the database queries executed during a request, including the time taken for each query and the total execution time. This detail is crucial for identifying slow queries and optimizing them.
Timeline View: The timeline view allows you to see how different parts of your application executed over time, making it easier to spot performance bottlenecks. This includes the time taken by middleware, controller actions, and custom events.
Log Entries: Clockwork collects and displays log entries generated during the request. This feature provides an in-depth view of the application’s internal processes and aids in debugging performance issues.
Cache Usage: Understanding how your application utilizes cache can be pivotal for performance optimization. Clockwork shows cache hits, misses, and the amount of time spent reading from and writing to the cache.
Event Handling: Clockwork displays the events that were fired and the listeners that were executed, enabling you to identify performance hits caused by event handling in your application.
Once Clockwork is installed and configured, you can leverage it to monitor your application’s performance. By default, Clockwork data can be accessed via a browser extension or directly through a JSON API.
Here is how you can use the browser extension to inspect Clockwork data:
This hands-on monitoring helps you gain immediate feedback on performance changes resulting from your code modifications.
Clockwork provides actionable insights by highlighting areas that need optimization. For instance:
By utilizing Clockwork, you can gain the critical visibility needed to identify and address performance issues effectively, ensuring your Laravel application runs smoothly and efficiently.
In the next section, we will dive into how Laravel Page Speed can help in further optimizing your web assets for better load times.
## 10. Laravel Page Speed

Optimizing web asset delivery is crucial for reducing page load times and enhancing the overall user experience. The Laravel Page Speed package automates the optimization of web assets such as CSS and JavaScript, streamlining the process and significantly improving load times.

### Features of Laravel Page Speed

Laravel Page Speed offers a range of features aimed at minimizing the size and improving the efficiency of your web assets. Here are some of the key features:

- **Minification**: Reduces the size of CSS and JavaScript files by removing unnecessary characters, such as whitespace and comments, without affecting their functionality.
- **Inline Critical CSS**: Extracts and inlines critical-path CSS to minimize render-blocking styles, allowing your pages to load faster.
- **Defer JavaScript**: Defers the loading of JavaScript files to prioritize the loading of essential content first.
- **Remove Unused CSS/JS**: Identifies and removes unused CSS and JavaScript, ensuring only the necessary code is loaded.
- **Image Optimization**: Although primarily focused on CSS and JavaScript optimizations, Laravel Page Speed can also assist in optimizing image delivery via lazy-loading.

### Installation and Configuration

Installing Laravel Page Speed is straightforward. Begin by adding the package to your Laravel project via Composer:

```sh
composer require renatomarinho/laravel-page-speed
Next, register the middleware in your app/Http/Kernel.php file by adding the following lines:
protected $middleware = [
    \RenatoMarinho\LaravelPageSpeed\Middleware\InlineCss::class,
    \RenatoMarinho\LaravelPageSpeed\Middleware\ElideAttributes::class,
    \RenatoMarinho\LaravelPageSpeed\Middleware\InsertDNSPrefetch::class,
    \RenatoMarinho\LaravelPageSpeed\Middleware\RemoveComments::class,
    \RenatoMarinho\LaravelPageSpeed\Middleware\TrimUrls::class,
    \RenatoMarinho\LaravelPageSpeed\Middleware\DeferJavascript::class,
    \RenatoMarinho\LaravelPageSpeed\Middleware\CollapseWhitespace::class,
];
These middleware classes each perform a specific optimization task. After registering them, you can customize their behavior through the configuration file. Publish the configuration file as follows:
php artisan vendor:publish --provider="RenatoMarinho\LaravelPageSpeed\ServiceProvider"
The configuration file config/laravel-page-speed.php will now be available, allowing you to enable or disable specific optimizations as needed.
Implementing Laravel Page Speed can yield substantial improvements in your application's performance metrics. Here are some of the results you can expect:
Below is an example of a typical laravel-page-speed.php configuration file:
return [
    'css' => [
        'minify' => true,
        'inline' => true,
    ],
    'js' => [
        'defer' => true,
        'remove_unused' => true,
    ],
    'images' => [
        'lazy_load' => true,
    ],
    'html' => [
        'collapse_whitespace' => true,
        'remove_comments' => true,
        'trim_urls' => true,
    ],
];
By selectively enabling or disabling options, you can fine-tune the performance improvements to align with your specific application needs.
Laravel Page Speed simplifies the often complex task of web asset optimization, providing automatic and configurable solutions to enhance the performance of your Laravel applications. This package is an essential tool for developers aiming to deliver fast, responsive, and high-performing web applications.
In any application development lifecycle, ensuring that your Laravel application can handle the expected load is crucial. This is where load testing becomes an indispensable part of performance benchmarking. Load testing simulates concurrent users and transactions on your application to evaluate its behavior under both normal and peak conditions. It helps identify performance bottlenecks, potential crash points, and areas that require optimization. Let's delve into how LoadForge can be leveraged to test, analyze, and optimize the performance of your Laravel application.
Effective load testing can uncover several critical insights:
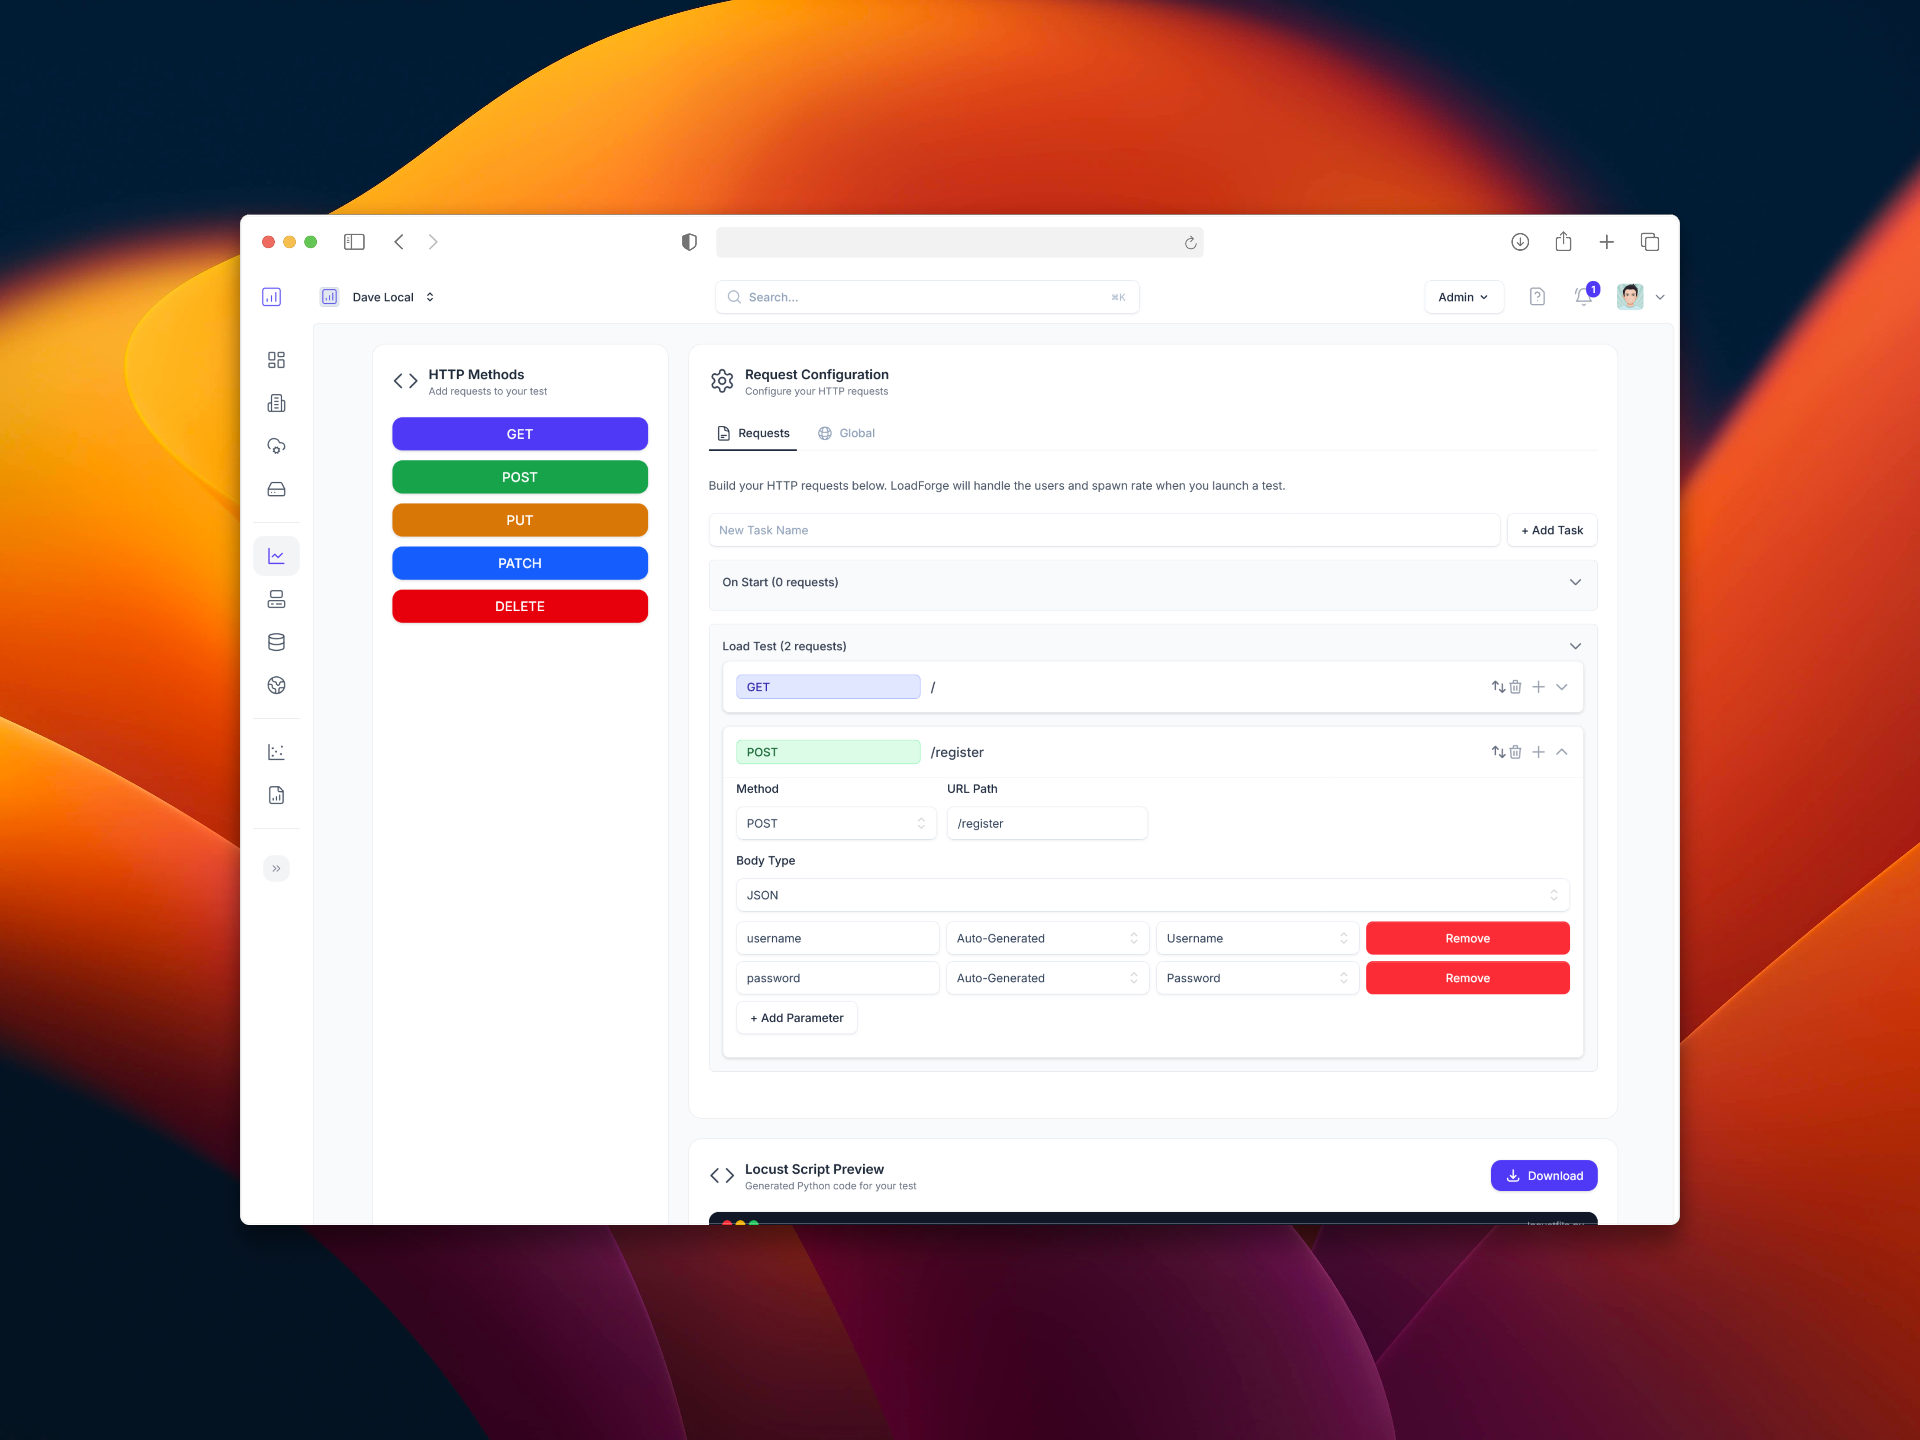
LoadForge offers a robust and user-friendly platform for conducting comprehensive load tests. Its functionalities are designed to cater to developers and testers striving to ensure optimal performance for their web applications.
Getting started with LoadForge is a straightforward process. Below are some steps to help you set up and execute load tests on your Laravel application:
Sign Up and Create a Test Plan:
{
    "name": "MyLaravelAppTest",
    "url": "http://your-laravel-app.com",
    "type": "GET",
    "headers": {
        "Authorization": "Bearer your-token"
    }
}
Configure Load Scenarios:
{
    "scenarios": [
        {
            "name": "Homepage Access",
            "requests": [{ "url": "/" }]
        },
        {
            "name": "User Login",
            "requests": [
                {
                    "url": "/login",
                    "method": "POST",
                    "body": {
                        "email": "[email protected]",
                        "password": "password123"
                    }
                }
            ]
        }
    ]
}
Run the Test:
Analyze the Results:
Analyzing LoadForge reports can point out specific performance issues such as slow database queries, inefficiencies in your code, or server configuration problems. Here are some common areas for improvement:
To maintain optimal performance levels, integrate LoadForge in your Continuous Integration/Continuous Deployment (CI/CD) pipeline. Automated load tests with every deployment ensure that performance regressions are caught early.
pipeline {
    agent any
    stages {
        stage('Load Test') {
            steps {
                script {
                    def response = sh(script: 'loadforge-cli run MyLaravelAppTest', returnStdout: true).trim()
                    echo response
                }
            }
        }
    }
}
Effective load testing with LoadForge provides insightful metrics that are instrumental in optimizing the performance of your Laravel application. By addressing identified bottlenecks and integrating load tests into your CI/CD pipeline, you can ensure a robust and resilient app capable of handling varying levels of user traffic.
Performance optimization is a critical aspect of developing and maintaining high-quality Laravel applications. Throughout this guide, we've explored various Laravel packages that can significantly enhance your application's performance. Let's quickly recap the key points covered:
Laravel Debugbar: This package offers a comprehensive debugging and profiling toolset. It helps you identify performance bottlenecks by displaying real-time data about your application's execution.
Laravel Horizon: By managing and monitoring your queues, Laravel Horizon ensures that queued jobs are processed efficiently, which can greatly improve your application's responsiveness.
Laravel Telescope: A valuable tool for monitoring and debugging, Telescope provides insights into requests, exceptions, database queries, and more. This helps in maintaining a performant and well-monitored application.
Spatie Laravel Responsecache: This package caches HTTP responses to reduce load times on repeated requests, improving user experience by serving cached content quickly.
Laravel Octane: Harnessing the power of concurrency, Octane helps you handle more requests per second by running your application on Swoole or RoadRunner, providing a significant performance boost.
Sentry Laravel: Beyond error tracking, Sentry offers performance monitoring capabilities that help identify and fix performance issues, contributing to a more stable application.
Laravel Query Detector: By detecting N+1 query issues, this package guides you in optimizing database queries, which is crucial for maintaining efficient data retrieval and minimizing load times.
Laravel Scout: Integrates with search engines like Algolia to provide fast and relevant search results, which can be pivotal for applications where search functionality is a core feature.
Clockwork for Laravel: This profiling tool delivers in-depth performance insights, allowing you to monitor and optimize various parts of your Laravel application efficiently.
Laravel Page Speed: Automatically optimizes web assets like CSS and JavaScript, which translates to faster page load times and improved overall user experience.
In addition to adopting these performance-enhancing packages, load testing is essential for understanding how your application performs under real-world conditions. LoadForge provides a powerful platform for stress testing and benchmarking your Laravel applications. By simulating various load scenarios, LoadForge helps you pinpoint performance issues before they impact your users.
Optimizing the performance of a Laravel application is an ongoing process that involves careful monitoring, proactive debugging, and regular testing. By leveraging the packages discussed in this guide, you can significantly enhance your application's performance, ensuring a smoother, faster, and more reliable user experience.
Remember, each application may have unique performance needs, so it's crucial to continually measure and analyze your application's behavior in production. Combining the right tools and practices will help you maintain optimal performance, keeping your users satisfied and your application running smoothly.
Adopting these best practices, monitoring your application's performance with robust tools like Laravel Telescope and Clockwork, and regularly load testing with LoadForge will keep you ahead in the performance game. By doing so, you'll not only provide a superior user experience but also ensure the scalability and longevity of your Laravel applications.