Jira Integration & Graphical Test Builder
We are proud to announce the release of two new features, available immediately. 🚀 Jira Integration: Automate Issue Tracking for...
Load testing is an essential aspect of developing robust web applications, and this is no less true for APIs built with Flask. Flask, being a lightweight and versatile web framework, allows developers to construct scalable and efficient web services easily....

Load testing is an essential aspect of developing robust web applications, and this is no less true for APIs built with Flask. Flask, being a lightweight and versatile web framework, allows developers to construct scalable and efficient web services easily. However, even the most well-designed APIs can succumb to performance issues under high traffic conditions if they are not properly tested. This is where load testing becomes crucial.
For Flask applications, load testing provides several key benefits:
Knowing the limitations of your Flask API is not just about seeing how much traffic it can handle before it fails. It’s about understanding how performance issues like increased response times and error rates correlate with different levels of load. This knowledge allows you to:
Without a clear understanding of how your Flask application scales, it might be challenging to ensure smooth user experiences as your user base grows. Load testing aids in this by helping you:
In summary, load testing your Flask APIs isn’t just about preventing crashes; it's about optimizing and delivering a seamless service experience. It helps developers and companies build confidence in their applications, ensuring they perform well, even under the most challenging conditions. In the following sections, we will delve into identifying key API endpoints for testing, setting up your Locust environment, and crafting your initial load test scenarios. By the end of this guide, you'll be equipped not only to execute effective load tests using LoadForge but also how to interpret and act on the results to continually refine your Flask applications.
Before you initiate a load test, it's essential to have a comprehensive understanding of the Flask API endpoints you plan to test. This knowledge will not only aid in creating effective tests but also ensure that you are focusing on areas critical to your application's performance and stability.
API endpoints are the touchpoints through which your users interact with your service. Here's how you can identify which endpoints are critical for testing:
High Traffic Volumes: Look at your analytics to see which endpoints receive the highest traffic. These are usually your application's core features.
Resource-Intensive Operations: Endpoints that involve database queries, file uploads/downloads, or intensive computational tasks should be prioritized as they might be bottlenecks.
Critical Business Functions: Identify endpoints that handle important business functions such as payment processing, order placements, or user registration.
Endpoints with Recent Changes: Any recent updates in your API endpoints should be thoroughly tested to ensure they perform well under different load conditions.
To effectively analyze your application, consider the following tools and approaches:
Swagger UI or Redoc: If your Flask application uses Swagger or Redoc for API documentation, it can be a very useful resource to understand all available endpoints and their details like HTTP methods, parameters, and expected responses.
Logging and Monitoring: Implement logs and monitor them to find frequently accessed endpoints. Tools like Grafana, Kibana, or even Flask's built-in logging can help in these tasks.
Code Review: Go through your route decorators in Flask. This is a straightforward approach to quickly identify all available endpoints. For example:
from flask import Flask
app = Flask(__name__)

@app.route('/api/users', methods=['GET'])
def get_users():
    pass

@app.route('/api/users', methods=['POST'])
def add_user():
    pass

@app.route('/api/users/<int:user_id>', methods=['GET'])
def get_user(user_id):
    pass
This code snippet shows three different endpoints: retrieving all users, adding a new user, and retrieving a specific user. Each of these could be critical depending on the application's context.
Once you have identified your critical endpoints, it's important to establish what you aim to achieve with the load test. Consider the following:
Performance Baselines: Determine what acceptable performance looks like. Baselines can include response times, throughput, and error rates.
Scalability Limits: Understand how much user load your application can handle before performance degrades beyond acceptable levels.
Resilience: Test how well your application can handle abnormal behaviors such as sudden peaks in traffic.
Clear objectives help in creating a focused locustfile and ensure your load testing efforts are aligned with your overall performance goals.
A thorough understanding of your Flask application’s endpoints and key functionalities is crucial for effective load testing. By focusing on critical paths and establishing clear objectives, you can ensure that your tests will deliver meaningful insights into the performance and scalability of your API. The next step would be setting up your Locust environment, which we will cover in the following section.
Before you can start load testing your Flask API with LoadForge, you'll need to set up Locust on your local machine or development environment. Locust is an open-source load testing tool that requires a Python environment. This section will guide you through the installation process and basic configurations required to get started with writing your locustfile.
Ensure that you have the following prerequisites installed on your system:
You can install Locust using pip. Open your terminal or command prompt and execute the following command:
pip install locust
This command will install Locust and all necessary dependencies. To verify that Locust has been installed successfully, run:
locust --version
You should see the version of Locust displayed, confirming that it is ready to be used.
To organize your testing scripts and maintain clean code, create a new directory for your Locust projects:
mkdir locust_tests
cd locust_tests
Within this directory, you’ll maintain your locustfiles and any other supplementary files required for your tests.
Before writing your locustfile, it's essential to understand the basic configuration and options that Locust offers. Here’s a quick rundown of the most important settings:
Create a simple configuration file to get familiar with these settings. In your project directory, create a new file named locust.conf:
touch locust.conf
Edit locust.conf to add basic configurations:
# locust.conf
host = https://your-flask-api.com
users = 50
spawn-rate = 10
run-time = 1m
This configuration file sets the target host, a maximum of 50 simulated users, a spawn rate of 10 users per second, and a total run time of 1 minute.
With Locust installed and your basic development environment set up, you’re ready to start writing your locustfile to define specific user behaviors and tasks for your load test. In the next section, we'll dive into creating your first locustfile to target your Flask API endpoints effectively.
Creating your first Locustfile for testing Flask APIs involves understanding the functionality of your API and how it will be used by your users. This section focuses on crafting a basic locustfile that tests typical HTTP requests (such as GET and POST) against your Flask API endpoints. This approach helps simulate real-world traffic patterns and API call behaviors to understand how well your API withstands various loads.
The first step in creating a locustfile is defining the user behavior model. This model includes the actions that simulated users (locusts) will take when they interact with your application.
Here is a simple example of a user behavior class that makes a GET request to fetch user information and a POST request to update user data:
from locust import HttpUser, TaskSet, task

class UserBehavior(TaskSet):

    @task(1)
    def get_user(self):
        self.client.get("/api/user/123")

    @task(2)
    def update_user(self):
        self.client.post("/api/user/123", json={"name": "Jane Doe", "email": "[email protected]"})
Once you've defined the user behavior, you can integrate it into the HttpUser class. This class represents a user interacting with the system, where you specify task sets and other user properties like the minimum and maximum wait times between executing tasks.
Here's how to integrate the previously defined UserBehavior into a HttpUser:
class WebsiteUser(HttpUser):
    tasks = [UserBehavior]
    min_wait = 5000  # Minimum wait time between actions in milliseconds
    max_wait = 9000  # Maximum wait time between actions in milliseconds
Now, integrate everything into a single locustfile. Here's a complete example of how your locustfile might look:
from locust import HttpUser, TaskSet, task, between

class UserBehavior(TaskSet):

    @task(1)
    def get_user(self):
        self.client.get("/api/user/123")

    @task(2)
    def update_user(self):
        self.client.post("/api/user/123", json={"name": "Jane Doe", "email": "[email protected]"})

class WebsiteUser(HttpUser):
    tasks = [UserBehavior]
    wait_time = between(5, 9)  # Using `between` to define a dynamic wait time
Before deploying your locustfile to LoadForge, test it locally:
.py extension.locust -f your_locustfile.pyhttp://localhost:8089 in your web browser.Testing your locustfile locally helps ensure that your scripts work as expected and that they are effectively simulating the desired behaviors.
Creating a locustfile tailored for Flask APIs involves defining user behaviors that mimic real-world usage, integrating these behaviors into user classes, and setting up the environment to execute tests. This locustfile lays the foundation for running scalable load tests on LoadForge, allowing you to analyze and optimize your Flask application’s performance under strain.
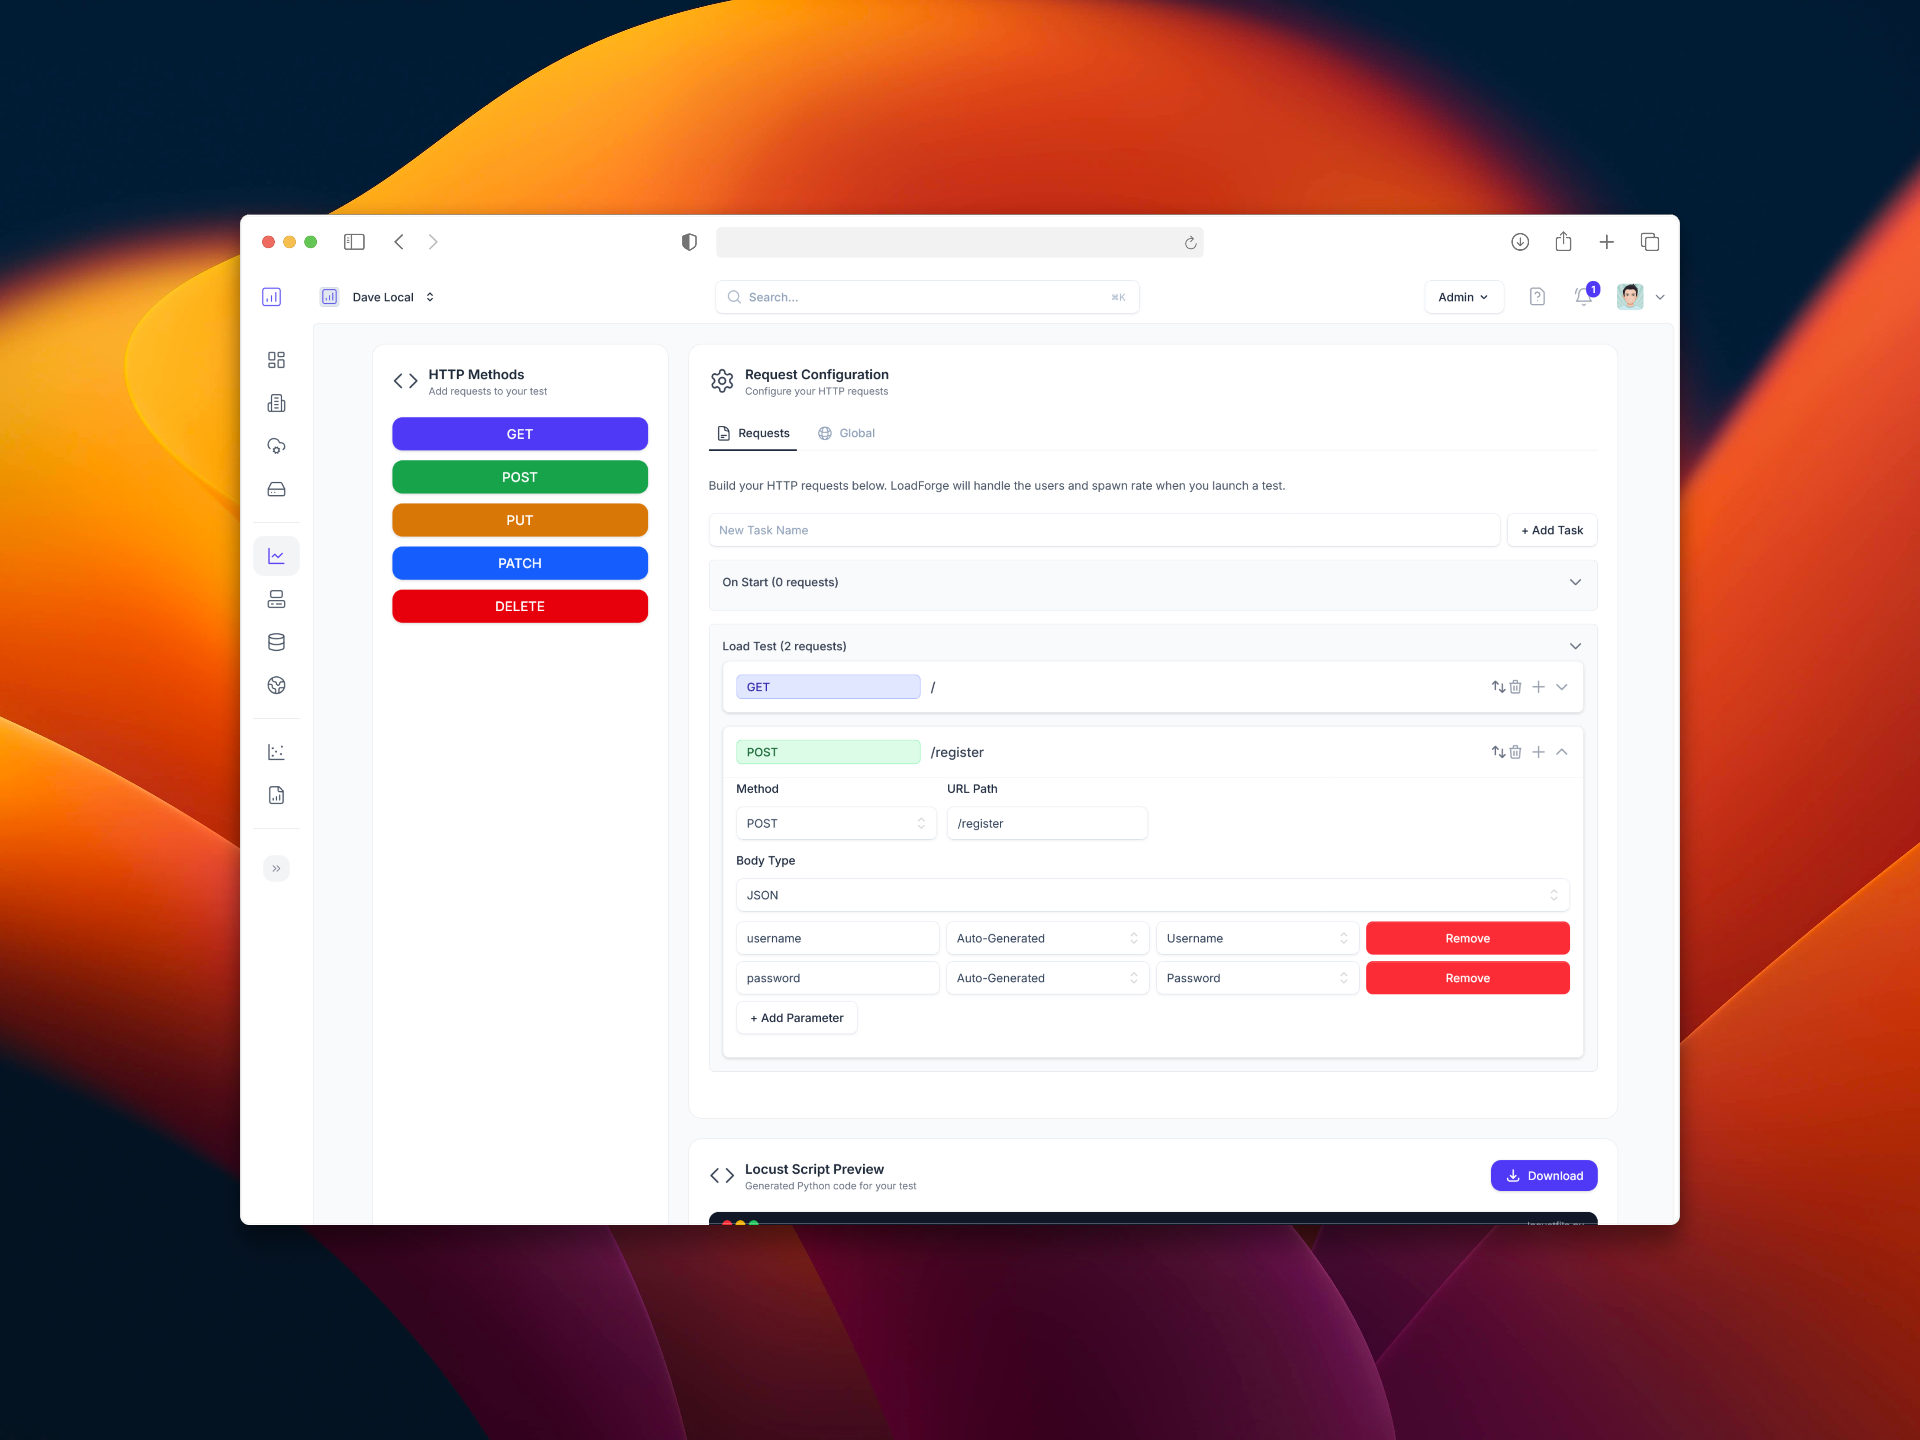
After creating your locustfile geared for your Flask APIs, the next step is conducting the actual load test using LoadForge. This section will guide you through the process of uploading your locustfile to LoadForge, setting up your test parameters, and launching the test. Follow these steps to ensure a successful and thorough examination of your API's performance under stress.
Once your locustfile is uploaded, you'll need to configure the test settings. This involves specifying the number of users, spawn rate, and test duration among other parameters. Follow these methods to correctly configure your test:
With your script uploaded and test parameters set, you're ready to start the load test:
While your test is running, it’s essential to monitor the performance metrics actively. LoadForge offers visual graphs and logs to aid this monitoring:
Executing load tests on LoadForge is streamlined to be straightforward yet powerful. By correctly configuring and running your tests, you'll gather crucial data on how well your Flask API performs under different stress levels. This data is invaluable for making informed decisions about optimizations and ensuring that your API can handle real-world use cases.
After successfully conducting your load test on LoadForge using your custom locustfile for Flask APIs, the next crucial step is to analyze the outcomes. LoadForge provides detailed metrics and graphs that can help you understand the performance characteristics of your API under various load conditions. This analysis is vital to pinpoint the strengths and detect any bottlenecks or weaknesses in your Flask application.
LoadForge generates several key metrics that you need to pay attention to when analyzing your test results:
LoadForge provides a range of graphs that visually represent the data collected during your tests. Here are a few key graphs to interpret:
Response Times Over Time
Number of Users vs Number of Failures
Requests per Second
Analyzing the output from LoadForge allows you to identify specific areas that may be causing performance degradation. Some common bottlenecks could include:
LoadForge offers advanced tools that can further aid in the analysis:
By thoroughly analyzing the test results provided by LoadForge, you can gain valuable insights into how well your Flask API performs under stress. Use this information to make informed decisions on where improvements are needed, ensuring that your API remains robust and scalable as demand grows.
After thoroughly analyzing the performance test results from LoadForge, it's crucial to translate these findings into actionable optimizations for your Flask API. This section provides comprehensive guidance on interpreting the test data and making informed decisions to enhance your API's performance and scalability.
Start by identifying the main performance bottlenecks that your Flask API encounters under load. Common issues might include long response times, high memory usage, or excessive CPU utilization. For example, if the response time increases significantly as the number of concurrent users grows, this can indicate a scalability issue within your API logic or database queries.
Optimize API Logic: Review your API endpoints for inefficient code paths or algorithms. Profile specific endpoints to understand where the execution is slow or where resource usage is high.
import cProfile
import your_api_module

def profile_endpoint():
    pr = cProfile.Profile()
    pr.enable()
    your_api_module.an_api_endpoint()
    pr.disable()
    pr.print_stats(sort='time')
Improve Database Queries: Slow database queries can dramatically impact API performance. Use query optimization techniques such as indexing, query restructuring, or batch processing.
CREATE INDEX idx_customer_name ON customers(name);
Implement Caching Strategies: Use caching mechanisms like Redis or Memcached to store frequently accessed data, reducing the need to repeatedly compute or retrieve it.
from flask_caching import Cache
cache = Cache(config={'CACHE_TYPE': 'redis'})

@app.route('/expensive_query')
@cache.cached(timeout=50)
def expensive_query():
    result = perform_expensive_query()
    return result
Scale Horizontally: Increase the number of worker nodes or instances running your Flask app to distribute the load more effectively. This is particularly useful if you have stateless API endpoints.
Upgrade Hardware: Sometimes, the solution may be as simple as upgrading your server’s CPU, memory, or network capabilities to better handle higher loads.
Use Load Balancers: Implement load balancers to efficiently distribute incoming network traffic across multiple servers, ensuring no single server bears too much load.
Implement continuous monitoring and load testing as part of your development cycle. This will help you catch performance regressions and assess the impact of changes in real-time.
Establish Performance Baselines: Regularly record performance metrics under normal load conditions to establish baselines for comparison during future tests.
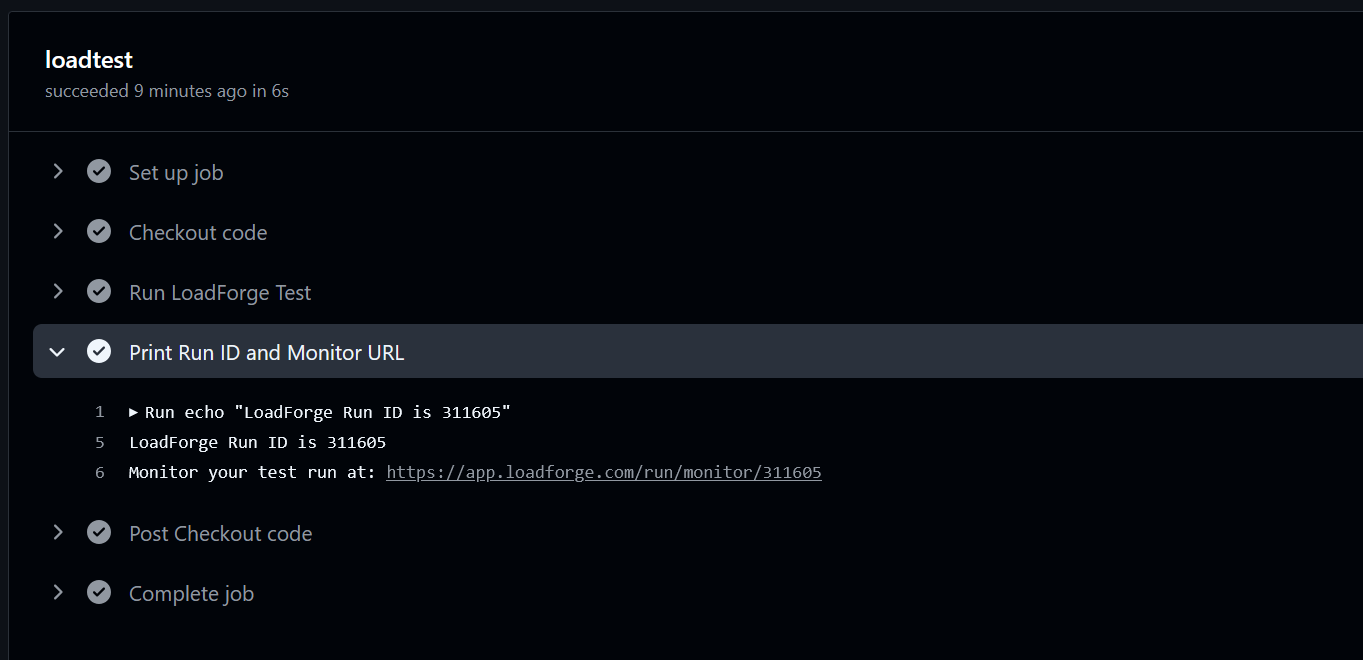
Automate Load Tests: Integrate LoadForge tests into your CI/CD pipeline to automatically evaluate the performance impact of code changes.
# Example script for CI/CD integration
import loadforge

lf = loadforge.Loadforge('YOUR_API_KEY')
new_test = lf.tests.create_from_template(template_id="TEMPLATE_ID", name="Nightly Load Test")
lf.tests.execute(new_test['id'])
By following the recommendations provided in this section, you can significantly enhance your Flask API's performance, reliability, and scalability. Always prioritize changes that offer the highest impact based on your specific test results and continue to refine your approach based on ongoing testing data. Remember, optimization is an ongoing process that plays a crucial role in the success of any API-driven application.