Performance monitoring
for growth teams
Monitor Core Web Vitals, Lighthouse scores, and response times from one command center. LoadForge surfaces trends, alerts, and benchmarks so your team stays ahead of every slowdown.
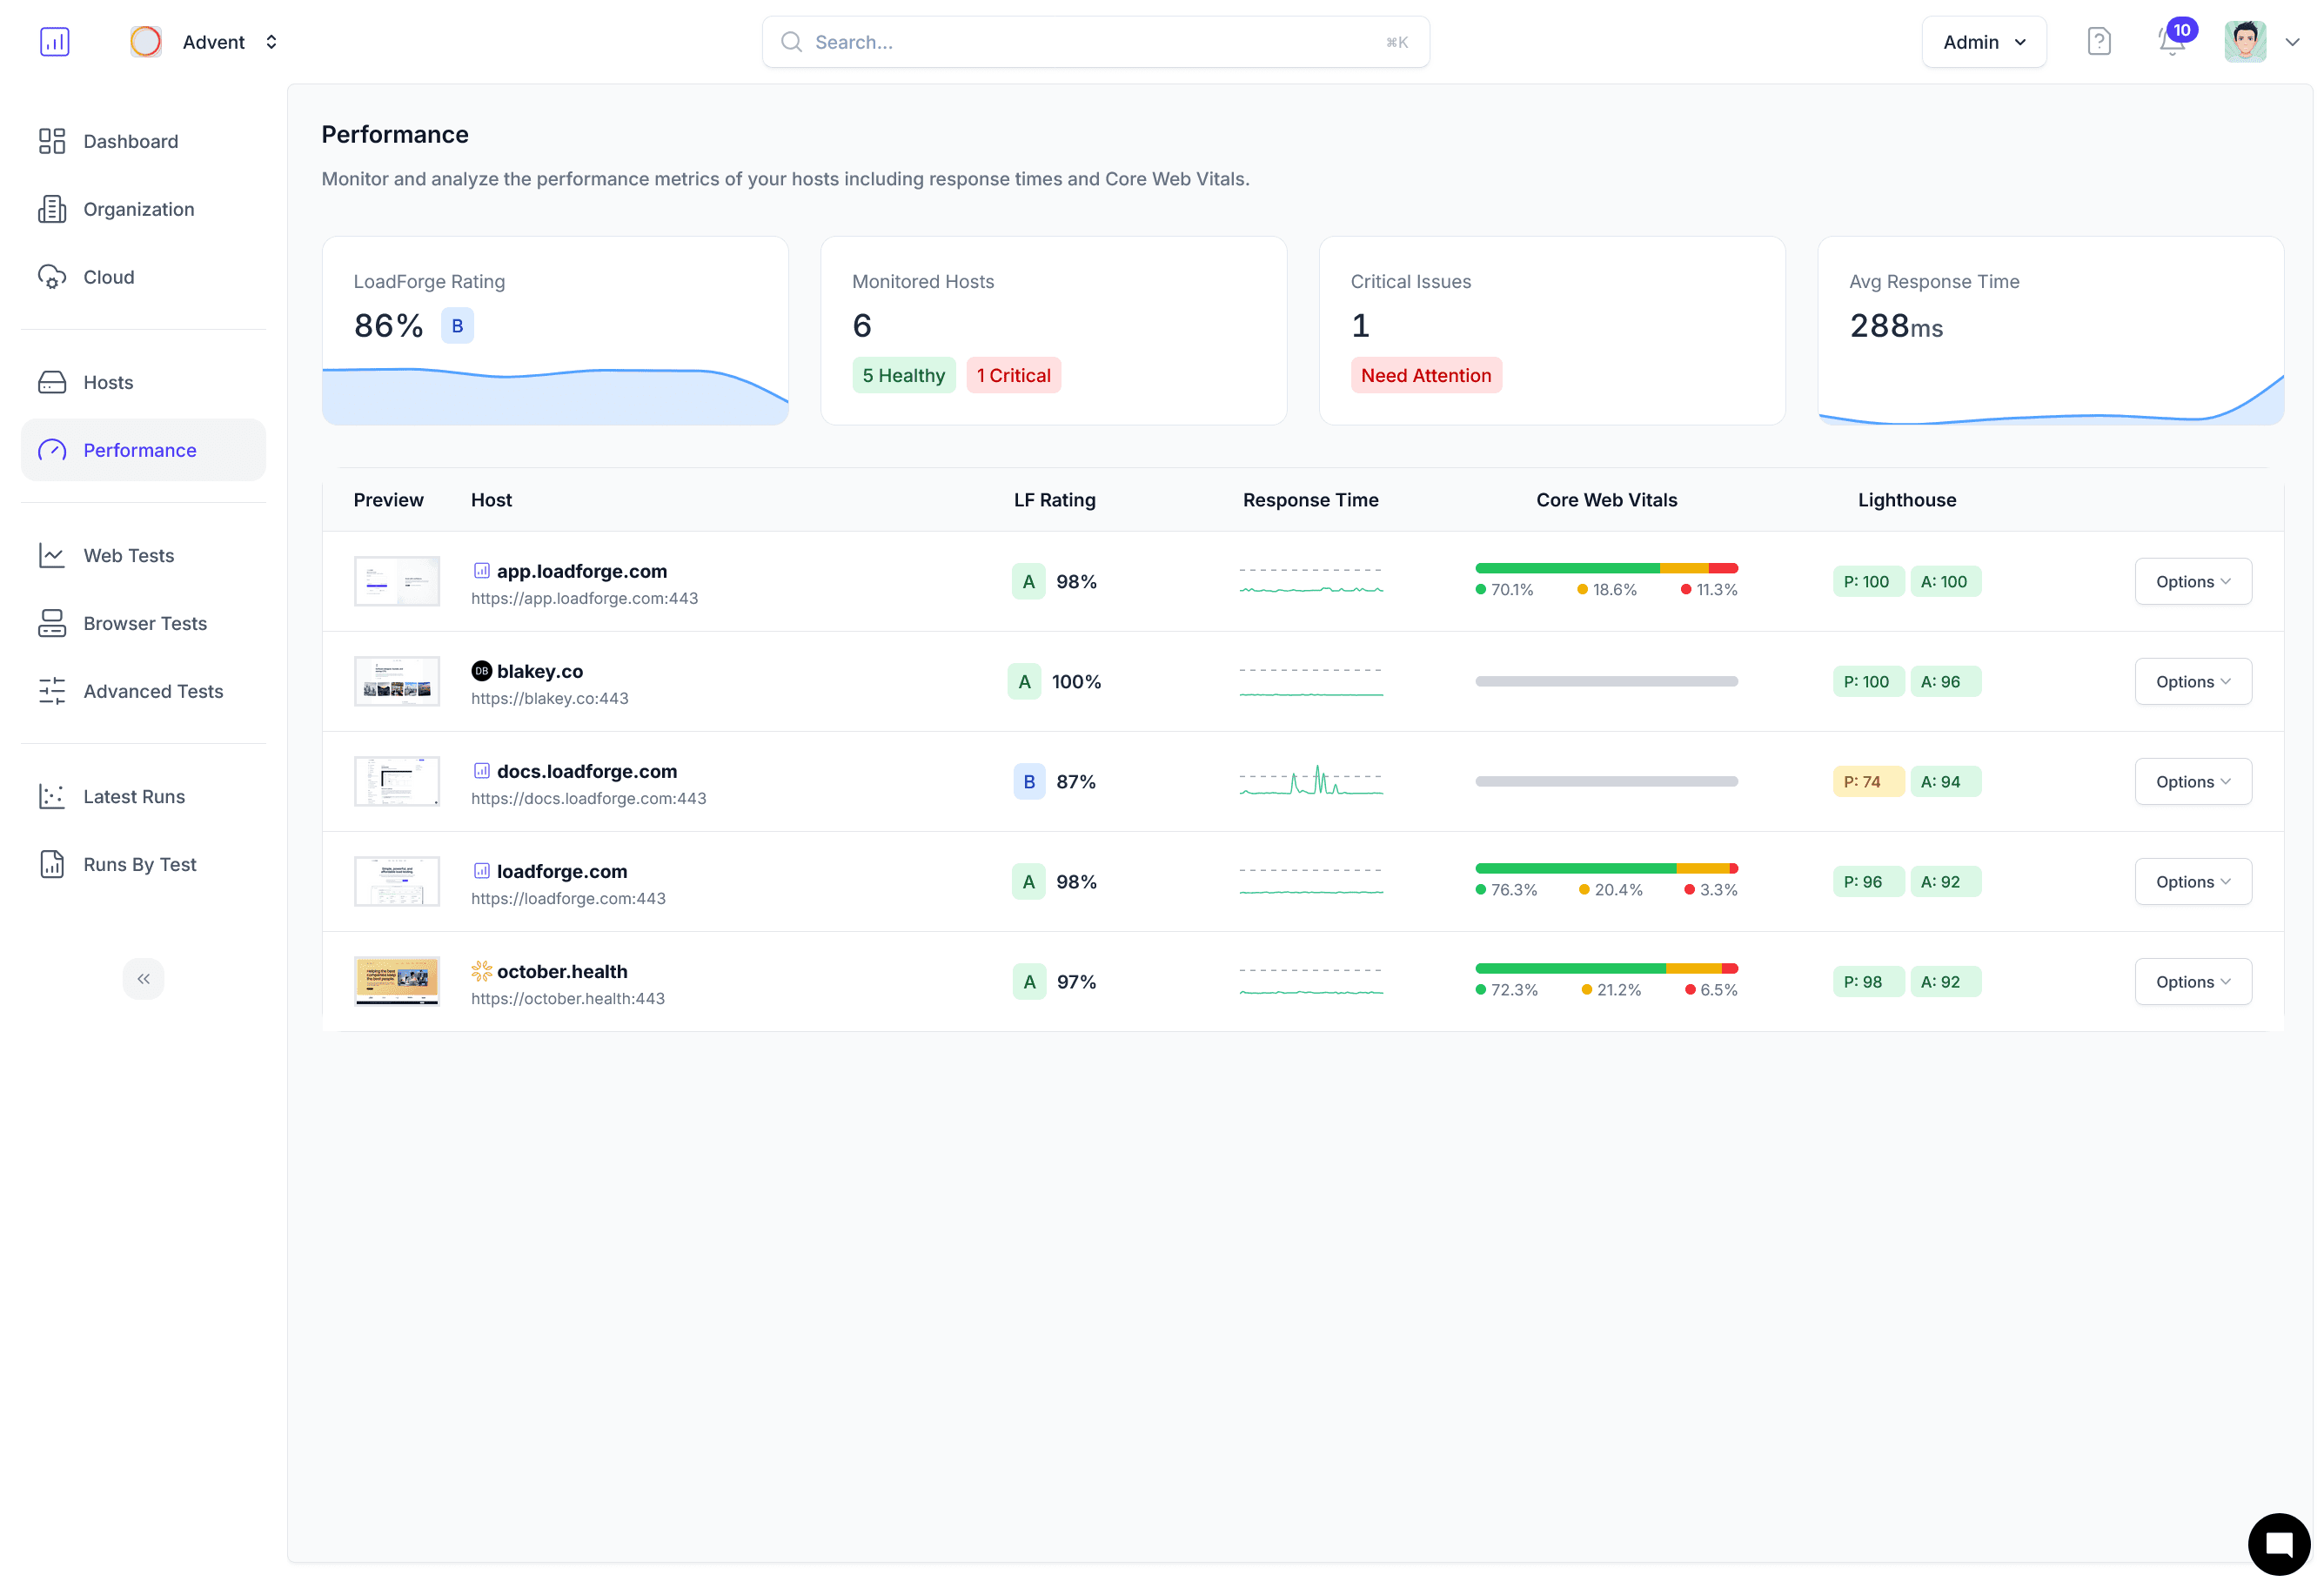
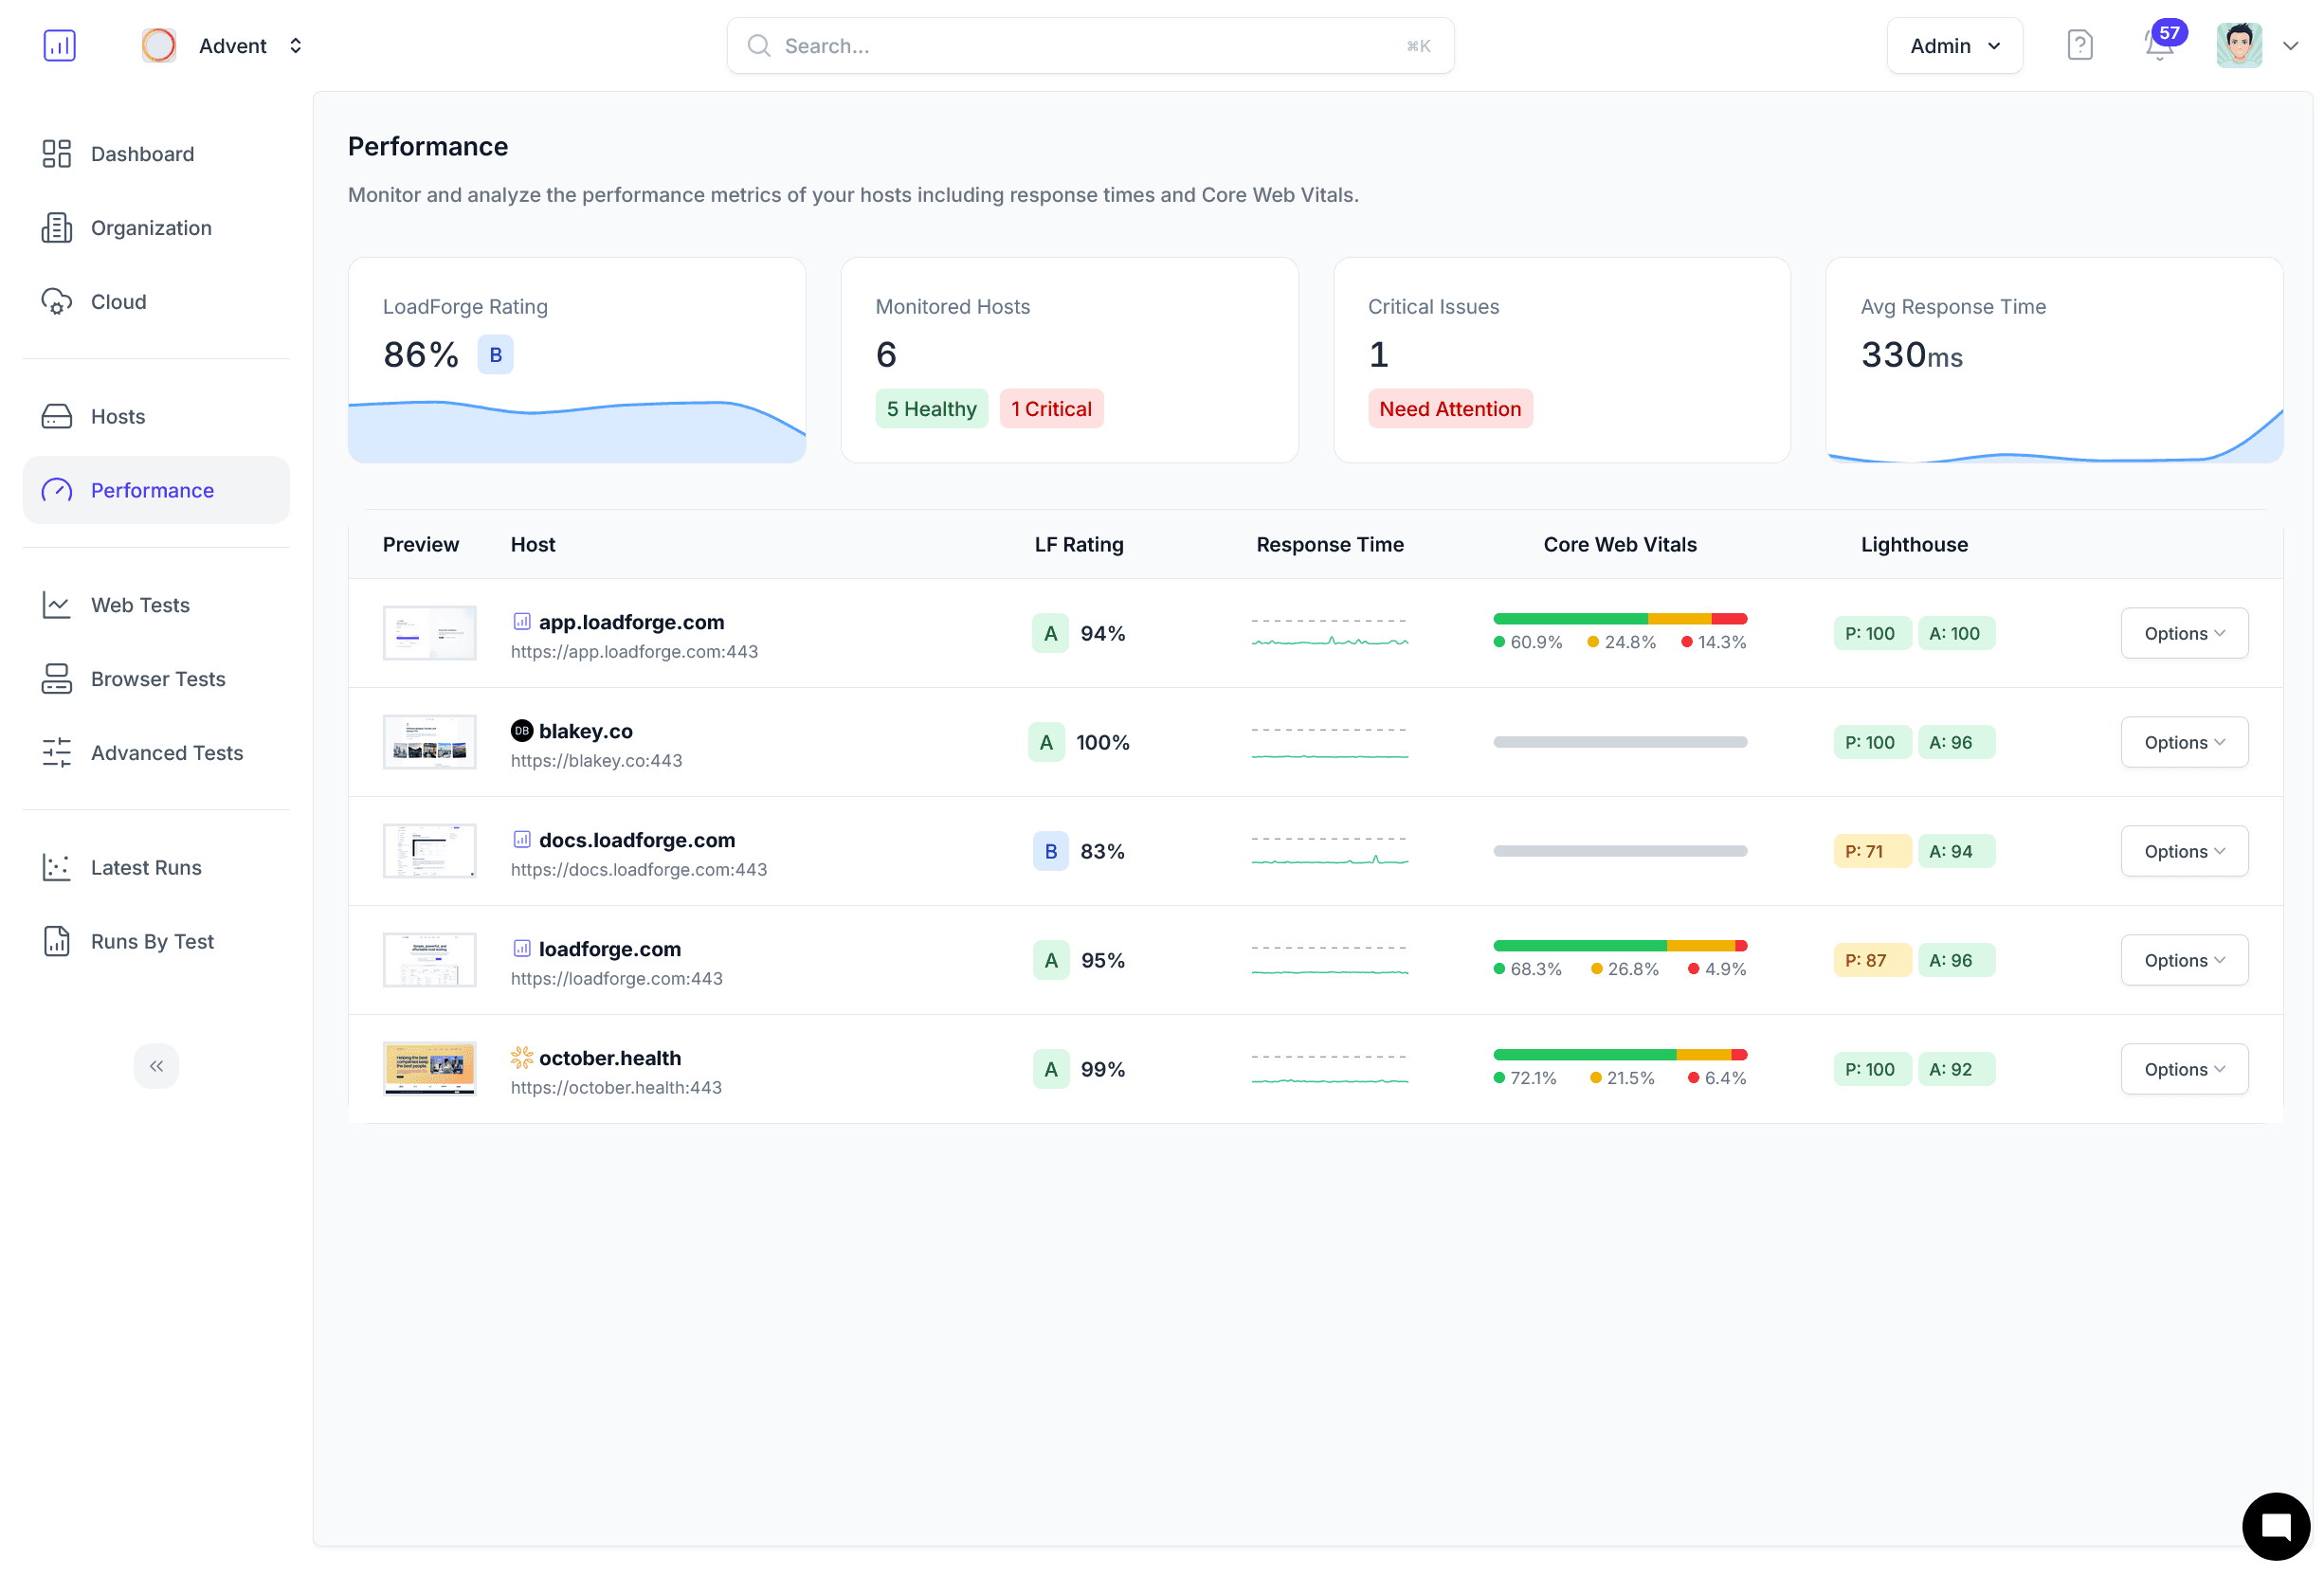
Monitor Core Web Vitals, Lighthouse, and uptime together
Every LoadForge monitor combines real-user telemetry, guided audits, and backend checks so teams can improve SEO rankings, conversions, and reliability from one dashboard.
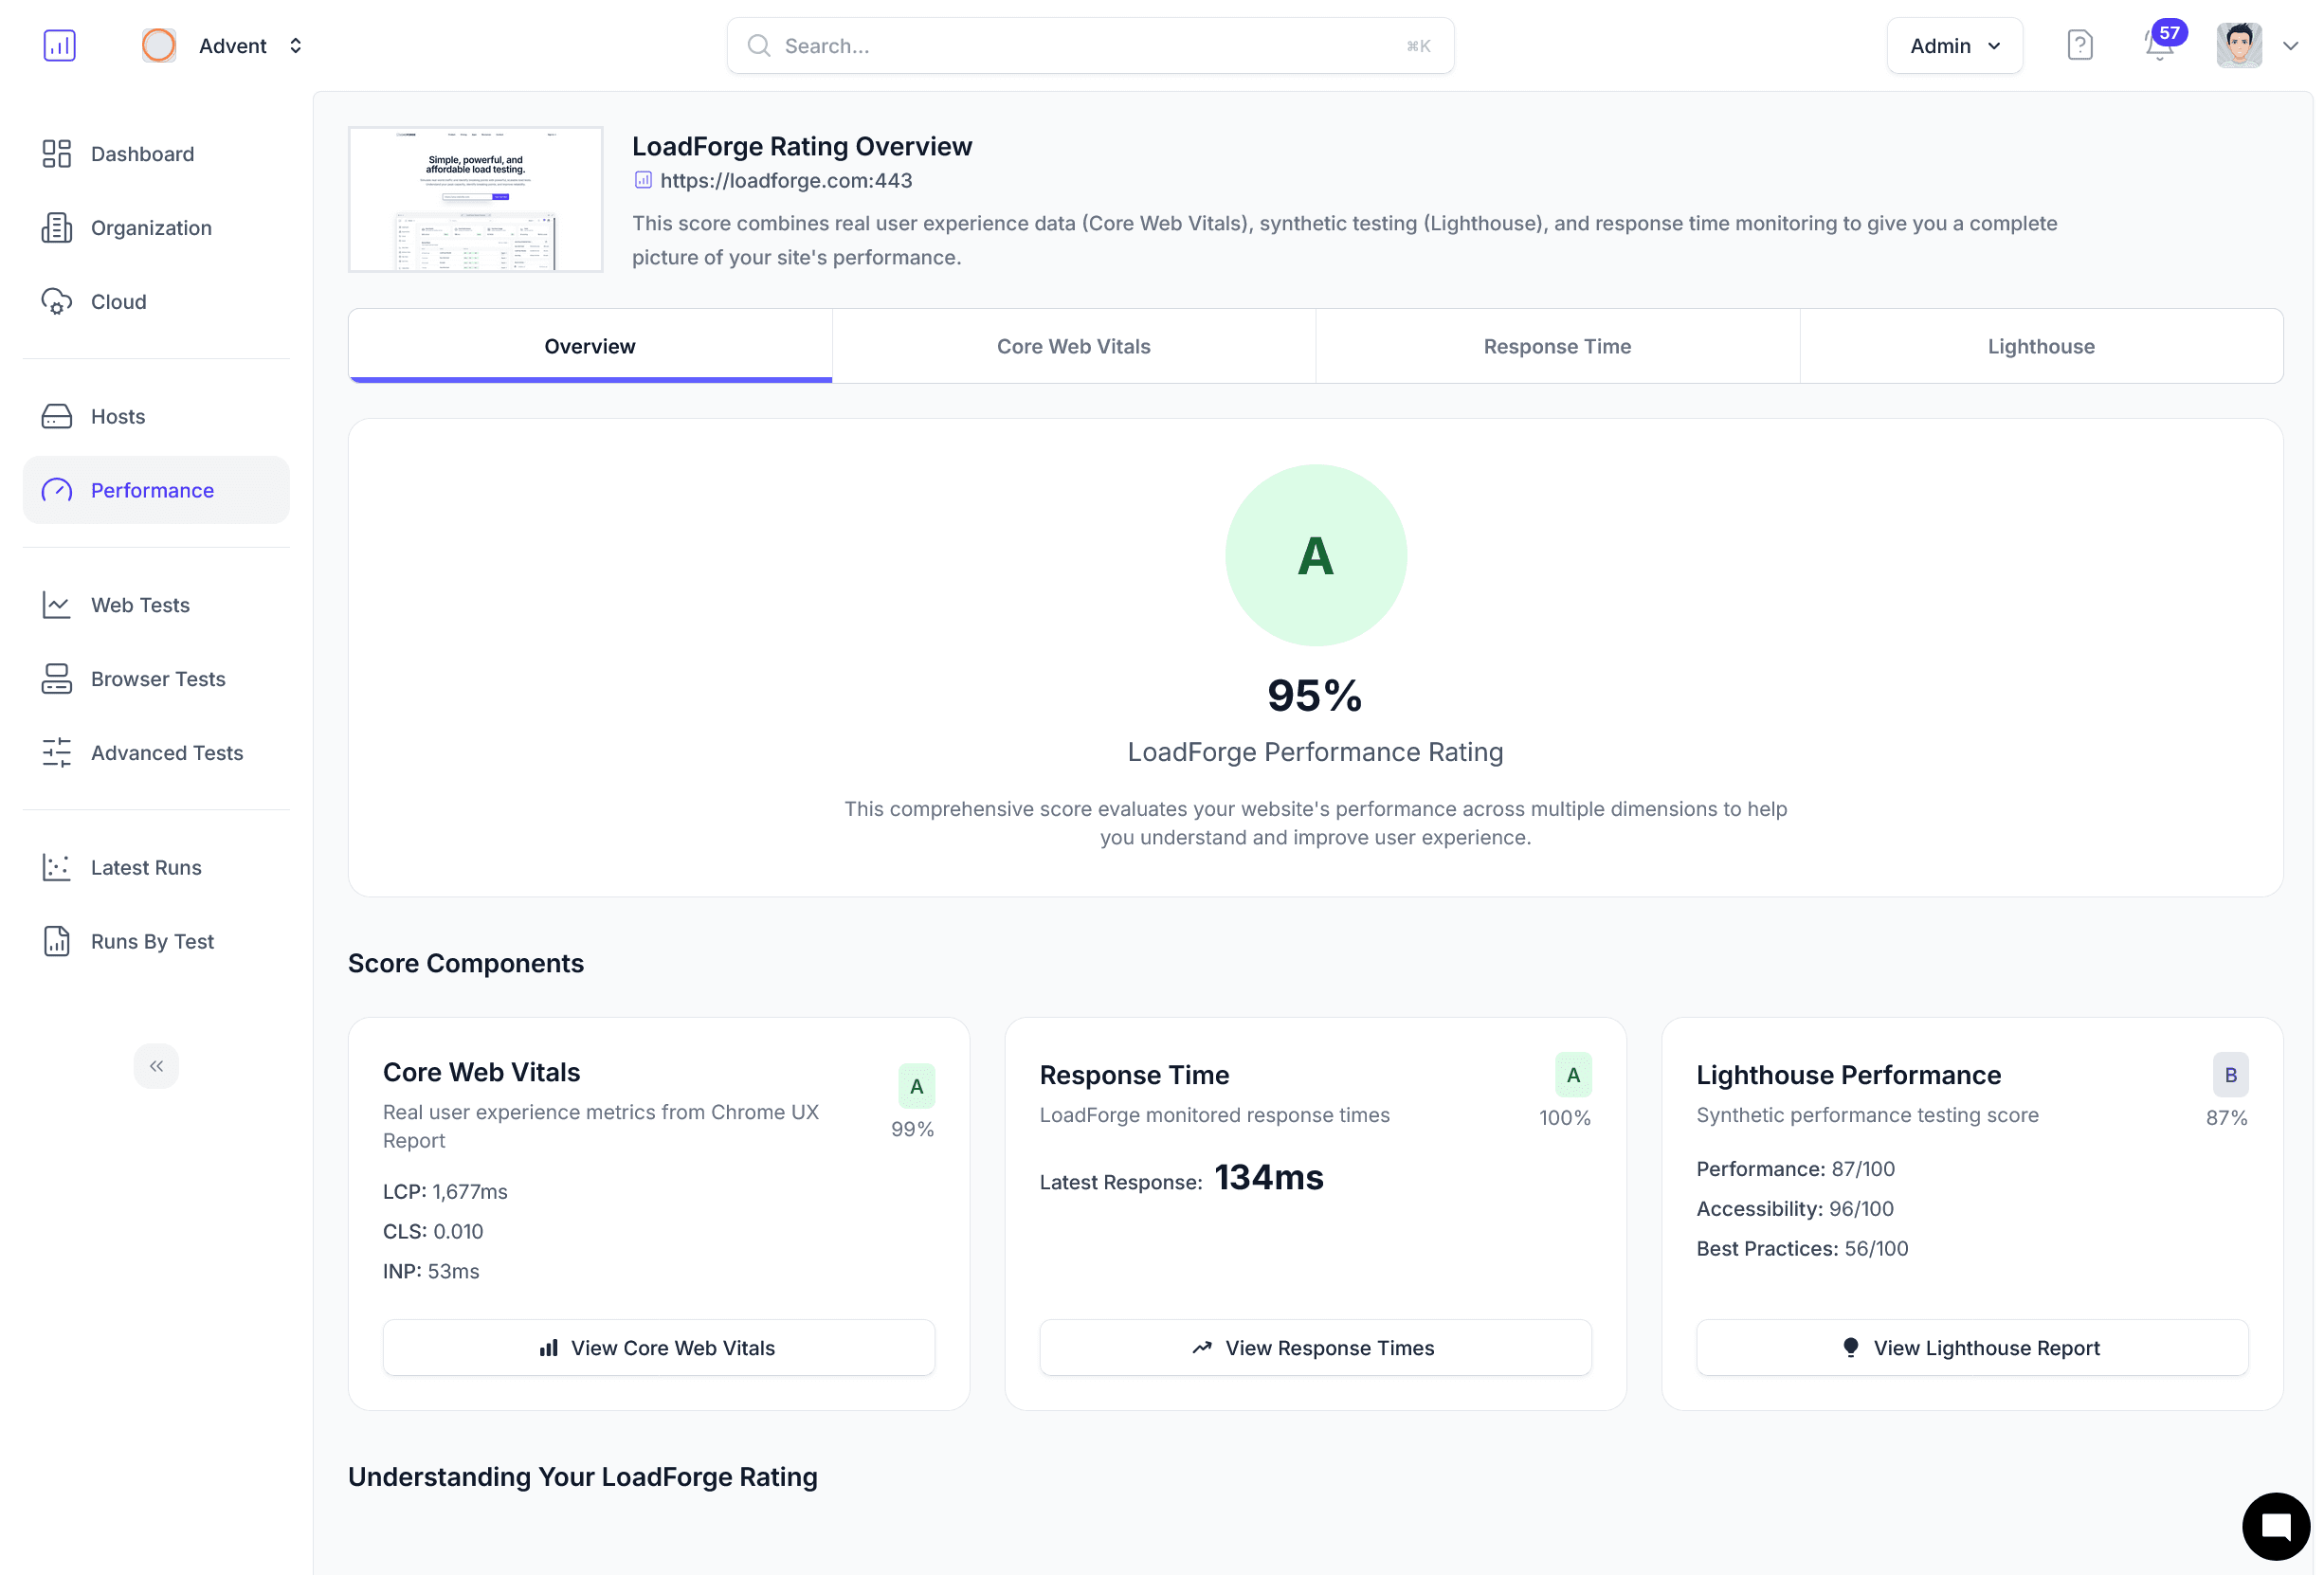
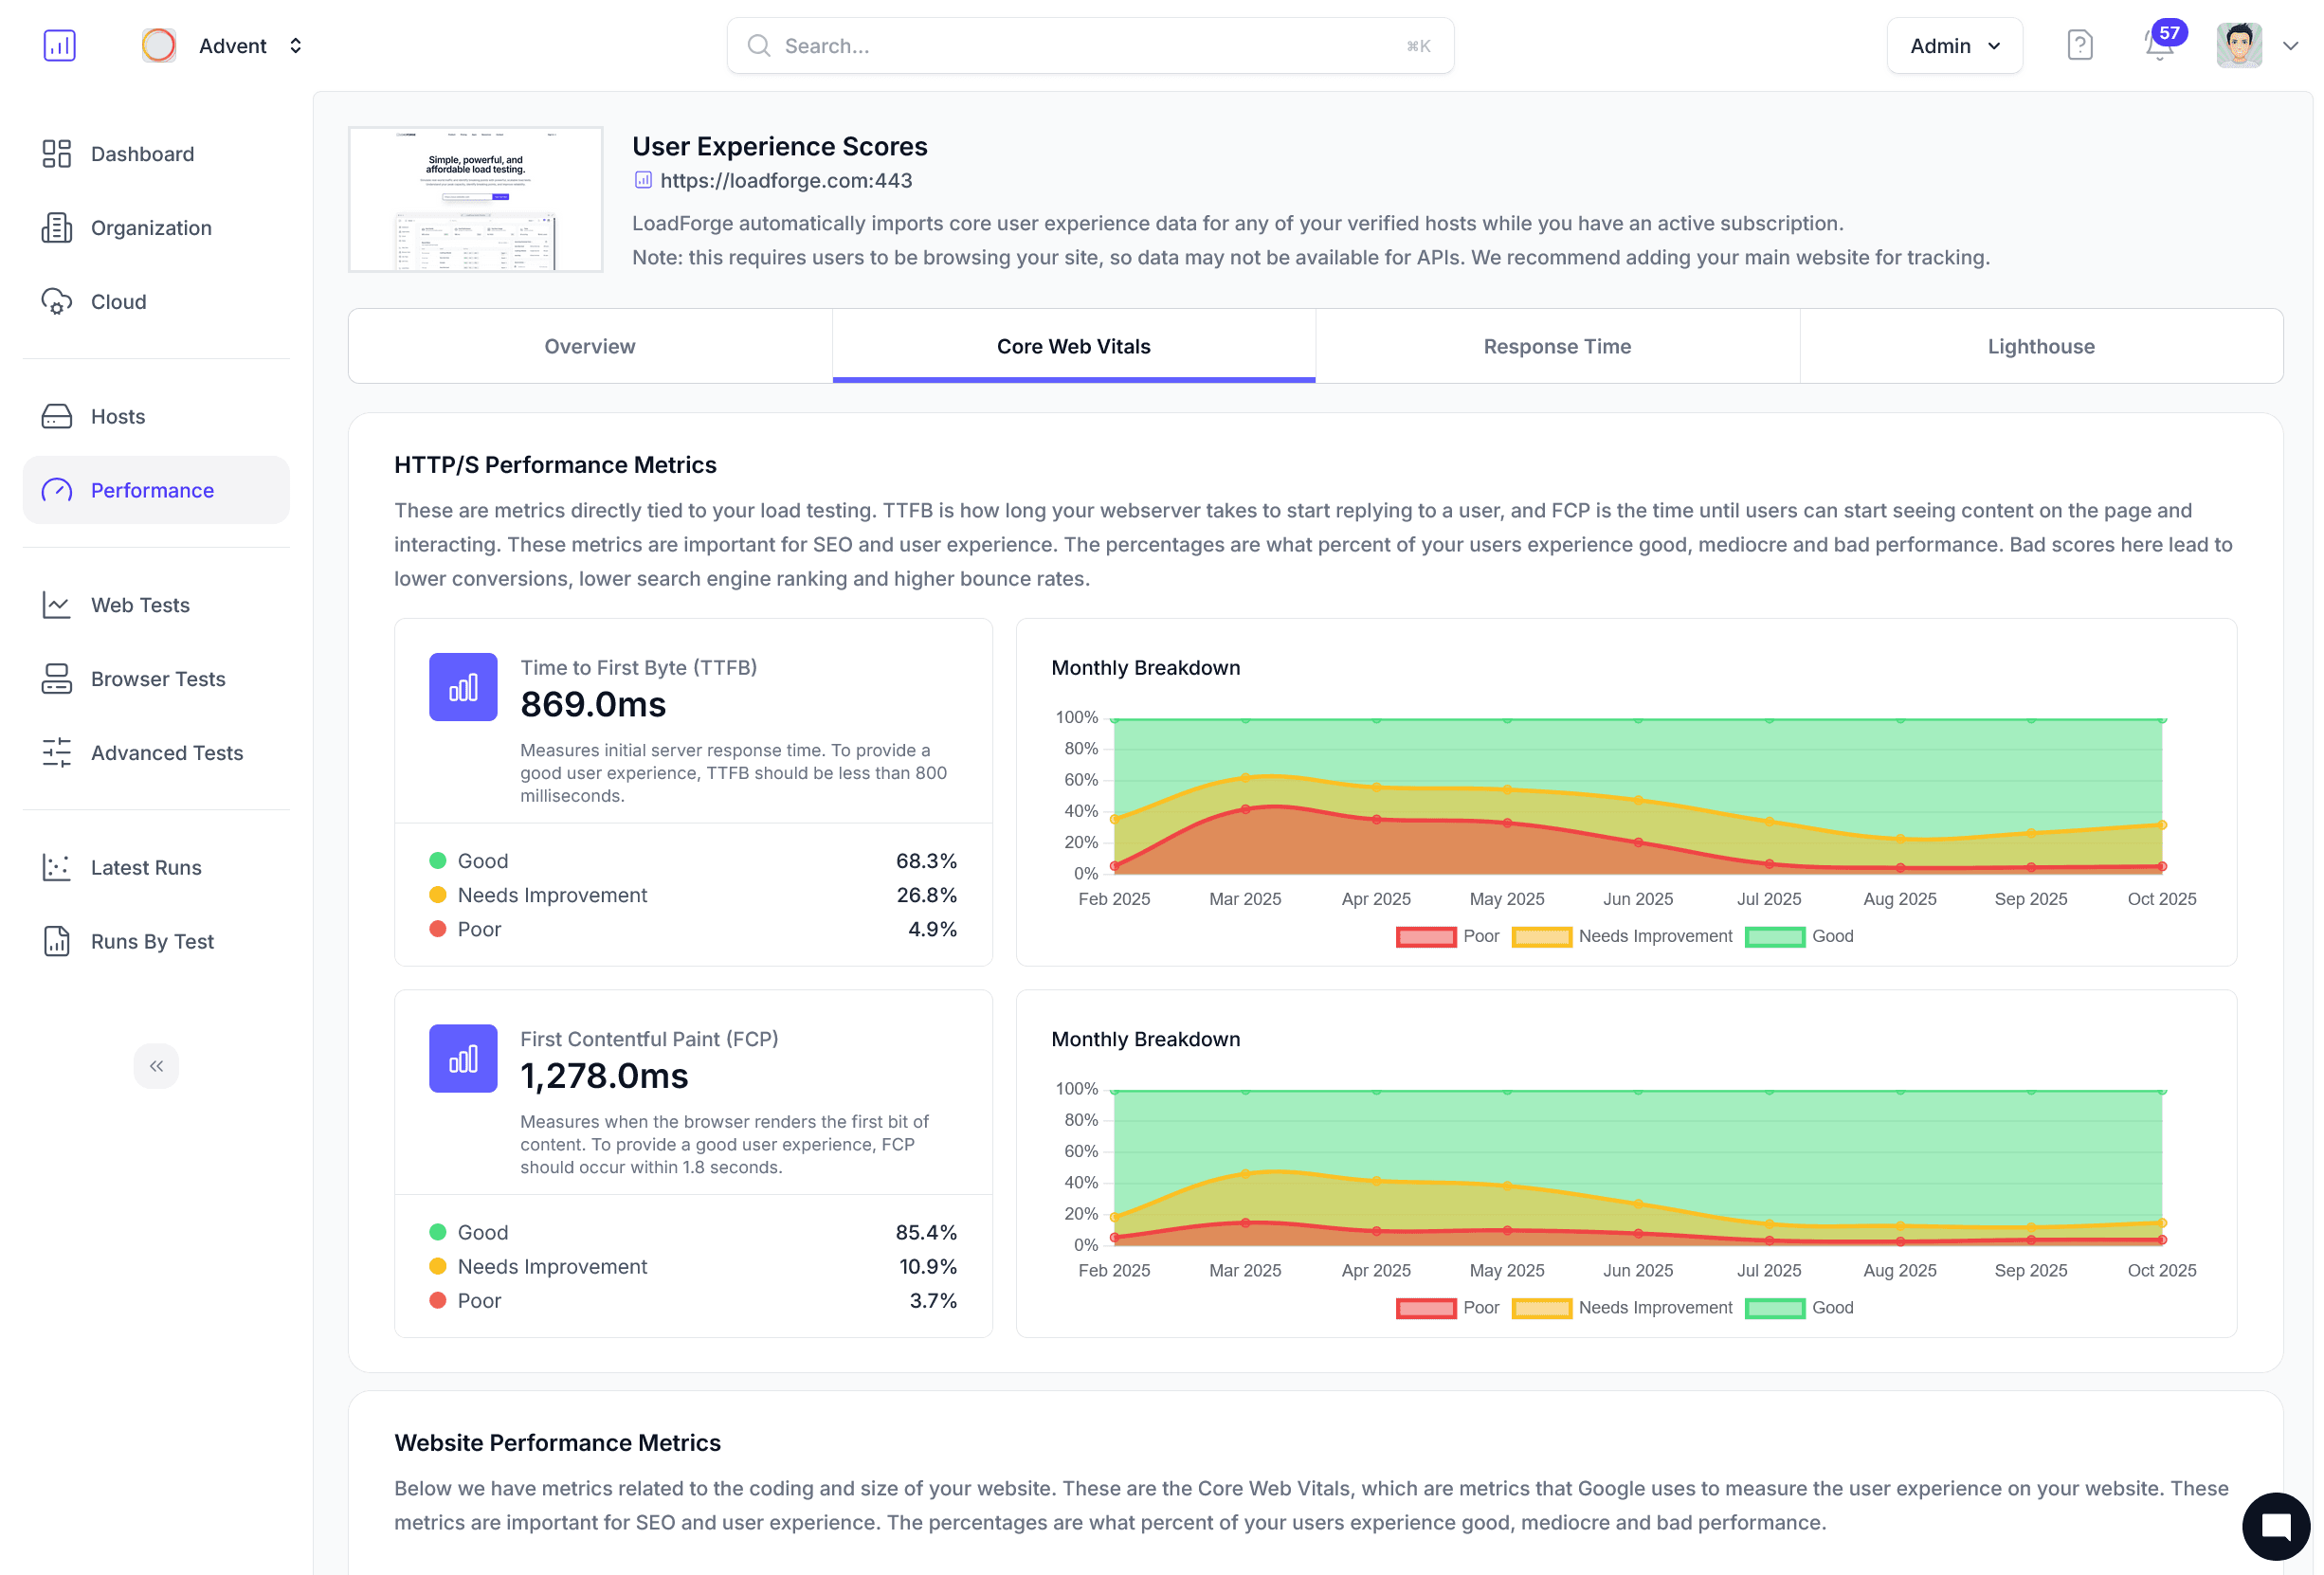
Real user experience data
Blend Chrome UX data with synthetic runs to understand how LCP, CLS, and INP shift in production.
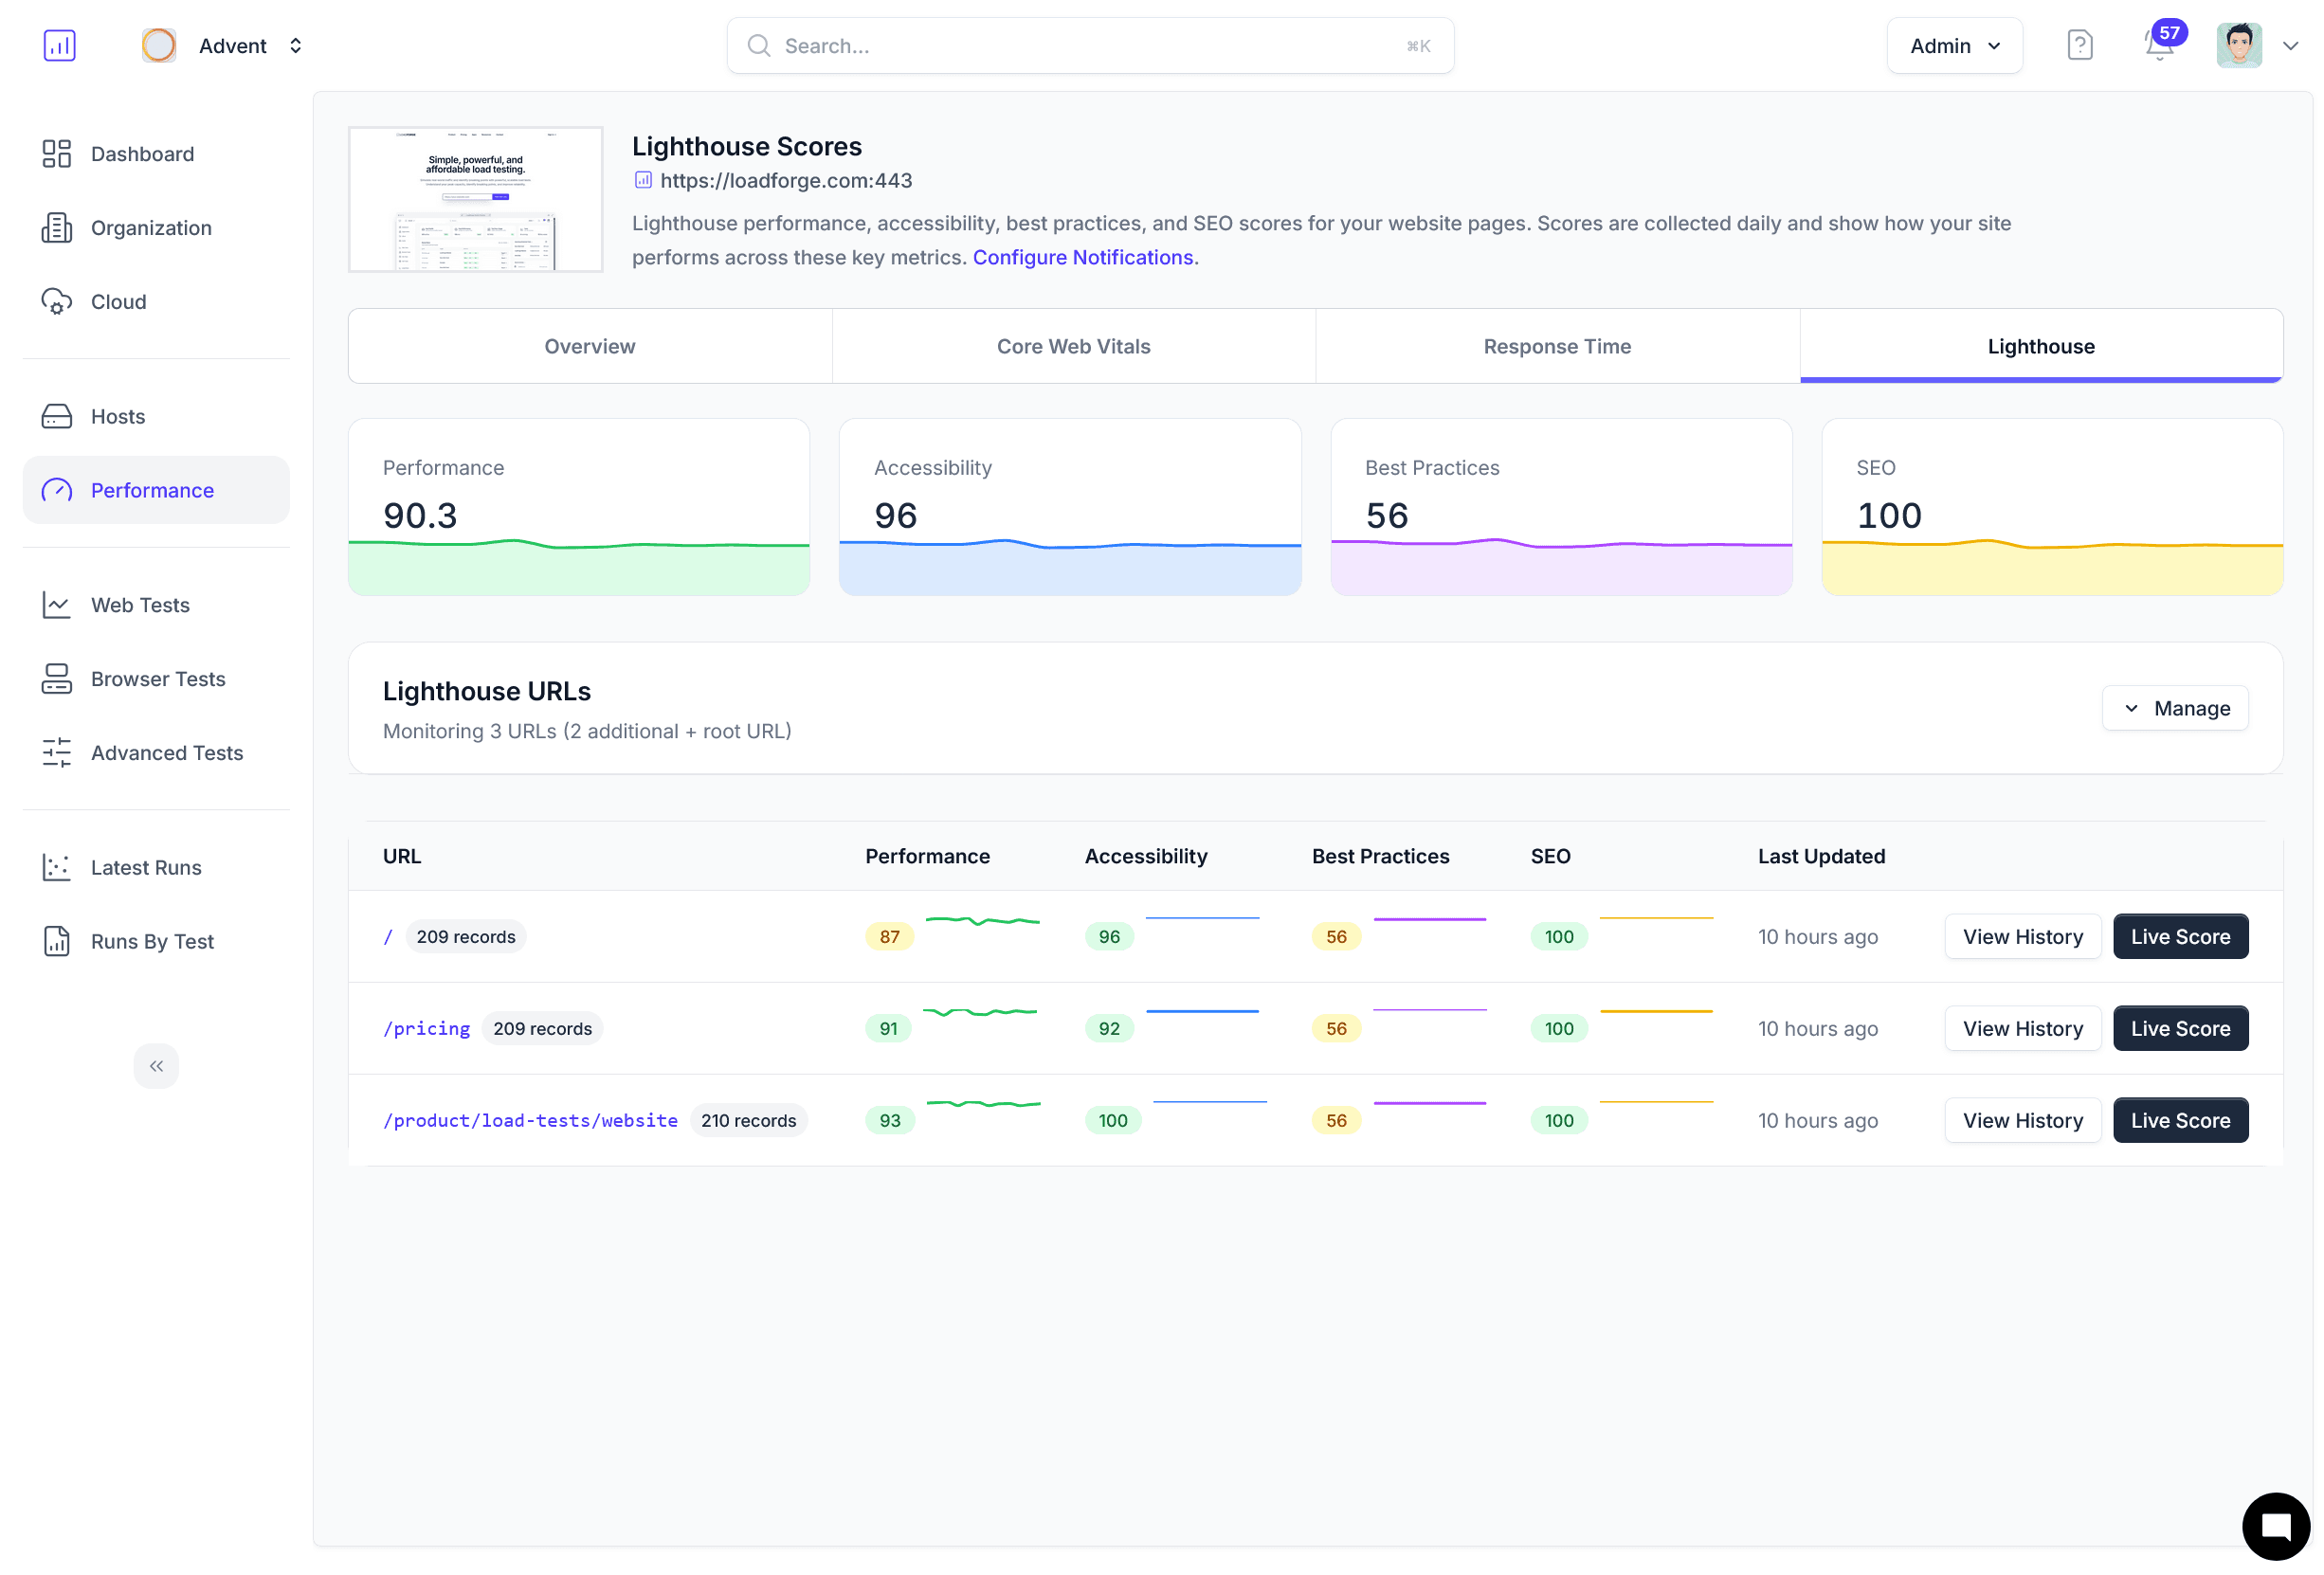
Scheduled Lighthouse audits
Automate Lighthouse performance, accessibility, SEO, and best-practices reviews with concrete fixes.
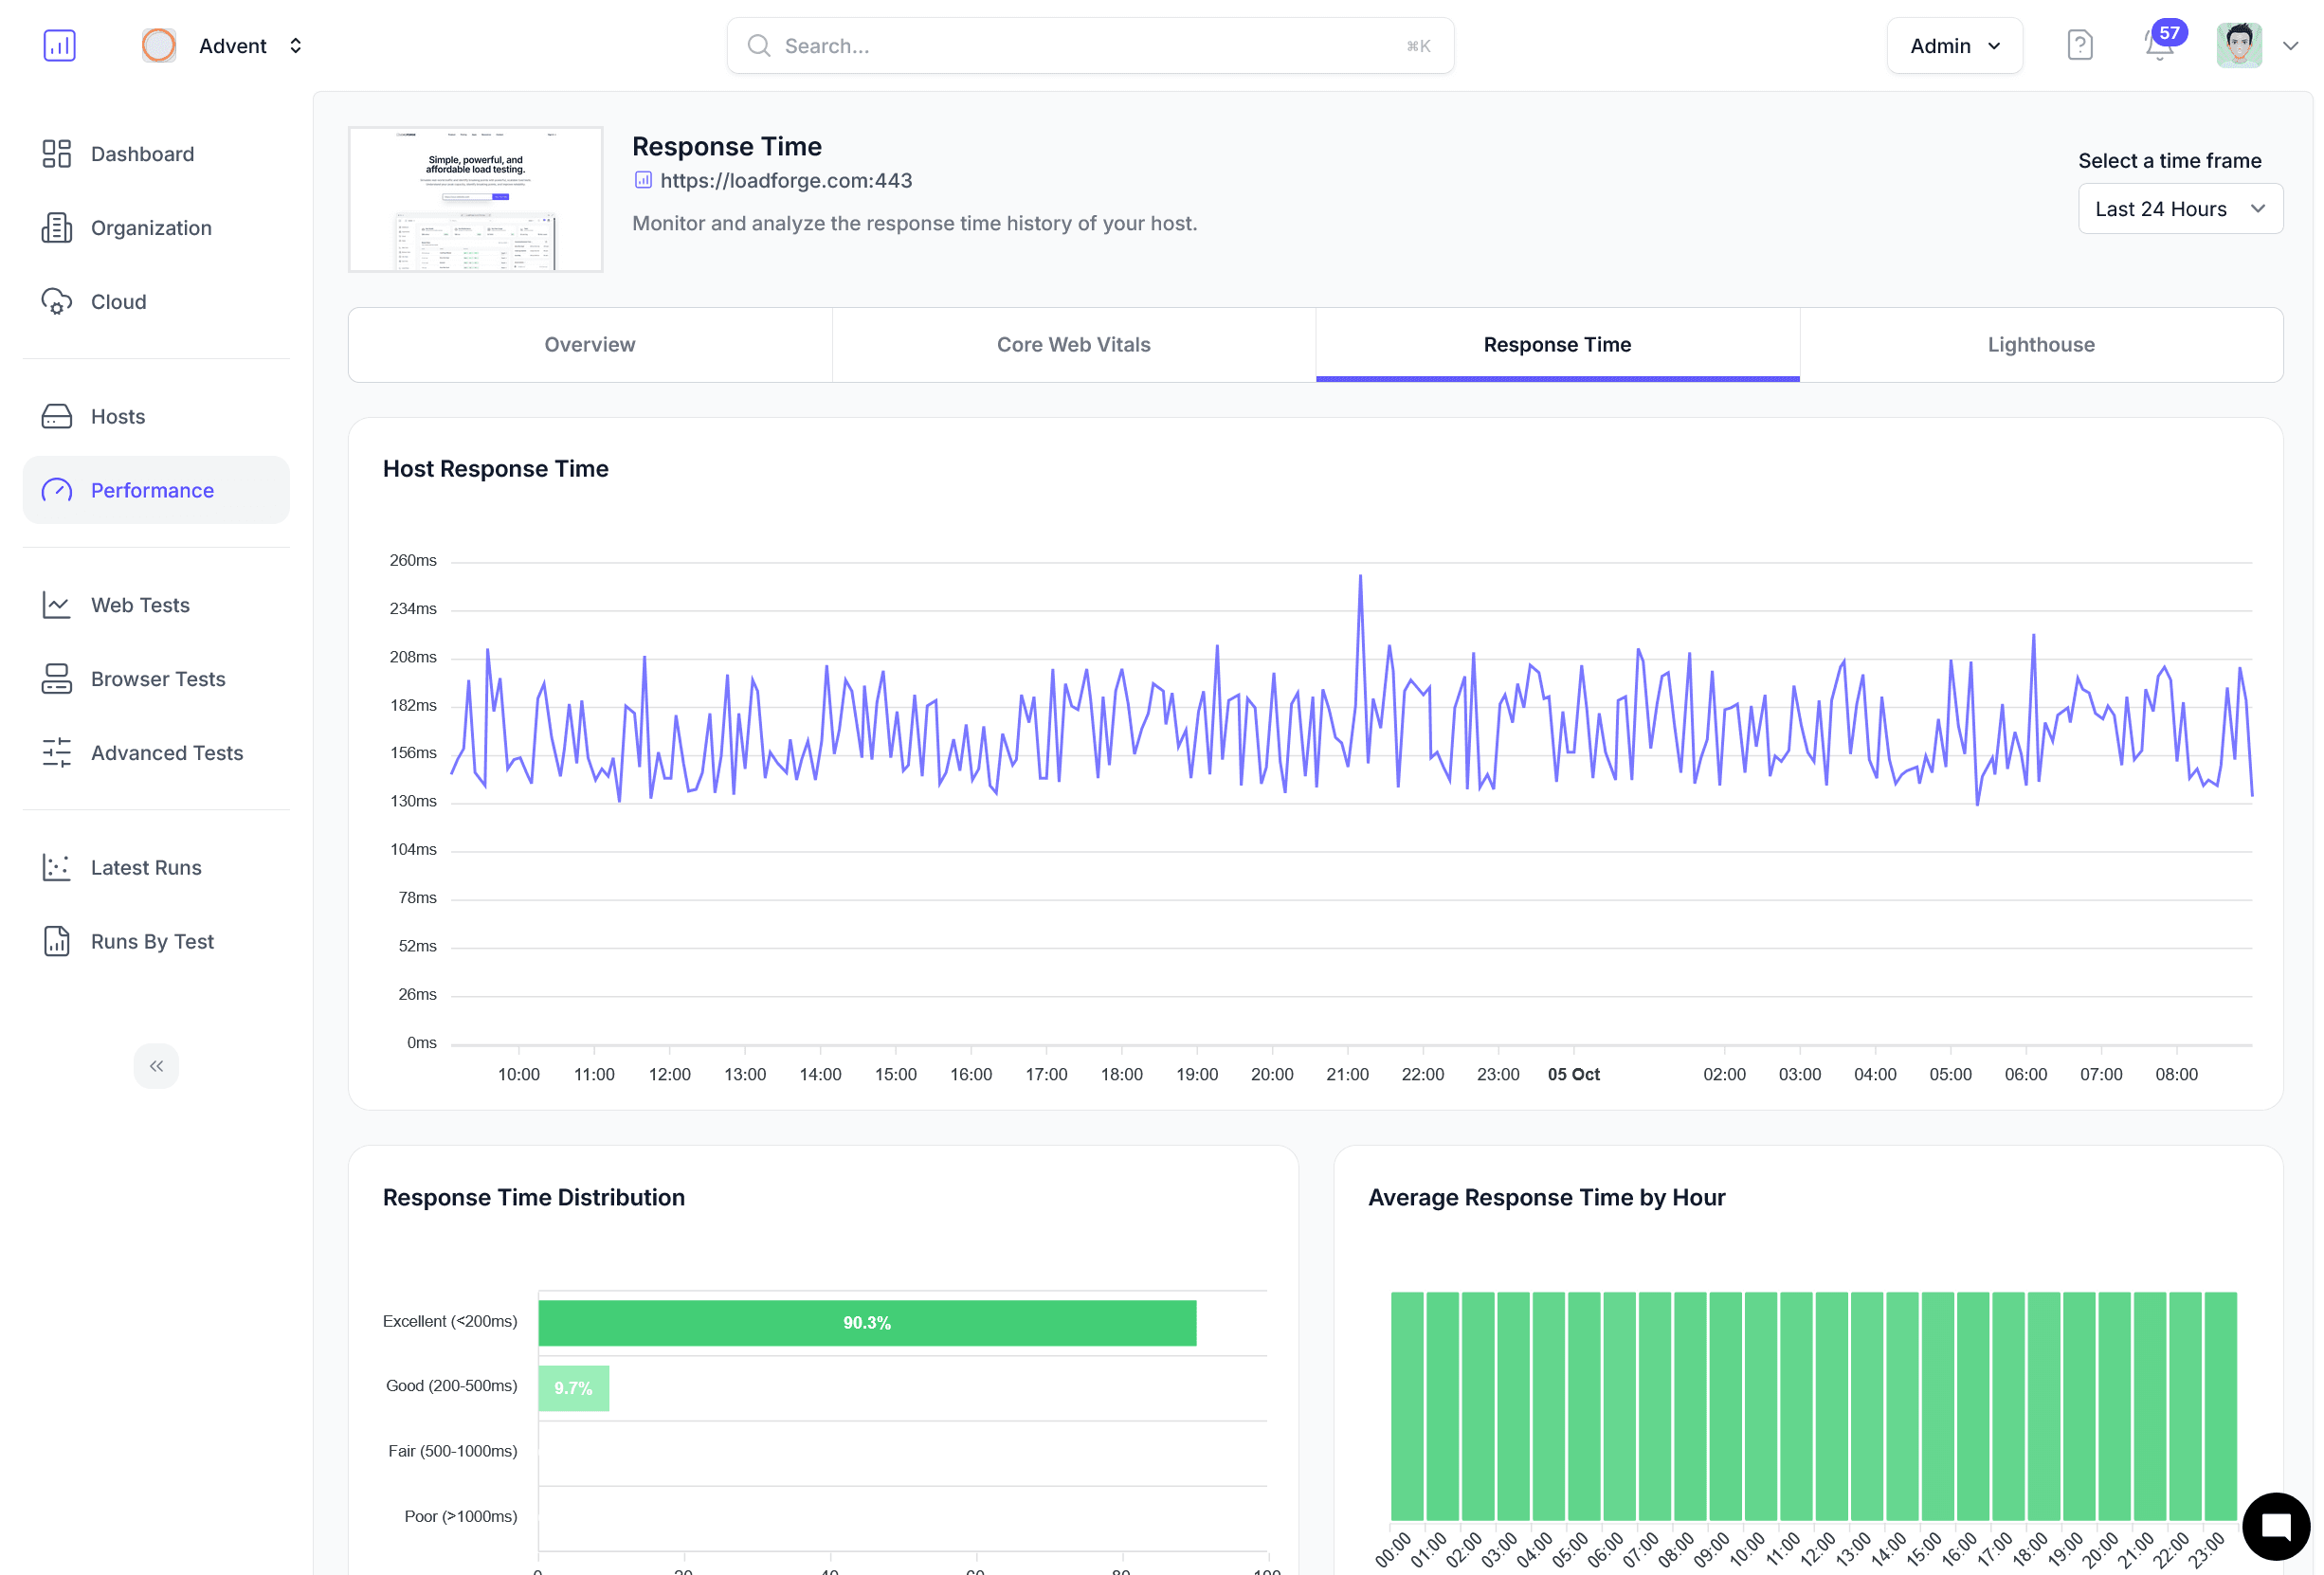
Response time tracing
Capture P95 and P99 backend performance so API slowdowns never hide behind healthy vitals.
Integrated with load testing
One platform to test for reliability, scalability, and performance while monitoring SEO metrics.
Instant anomaly alerts
Receive alerts the moment vitals, uptime, or Lighthouse grades slip below your thresholds.
Unified LoadForge Score
Roll every metric into a single A–F grade your stakeholders can understand at a glance.
From set up to actionable alerts in minutes
Launch monitors with a few clicks, then let LoadForge correlate vitals, audits, and response times so your team can act before customers notice.
Connect your properties
Point LoadForge to your websites, APIs, and digital experiences. LoadForge automatically monitors all verified hosts.
Automate audits & vitals
Schedule Core Web Vitals collection, Lighthouse reports, and response time probes with thresholds that match your SLAs.
Alert, compare, improve
Get alerted instantly, investigate historical trends, and track the LoadForge Score as optimizations roll out.
Trusted by 2.4k+ teams to scale their applications